Challenges
Complex analytics, poor user flow, minimal interaction
Overwhelming metrics discourage app usage
Professional Services written reports were cannibalizing usage of the platform
R&D priorities split between professional services & the web app, creating duplicated effort and inconsistent experience
Outcomes
Redesigned more explorable information architecture and UX
A new core interaction to integrate product into software development life cycle
An extensible mechanism for delivering actionable recommendations within the app
Wrangle the analytics platform and org. onto a common BI tool integration
Background
Sema makes code quality and development analytics for software development teams delivered through Angular web app, along with professional services and written reports. Their comprehensive metrics support digital transformation, technical due diligence, continuous improvement and software maintenance.
As product manager and design leader, I worked directly with research and engineering. I was the VP of Product's first hire, joining shortly before the launch of the web app. It was my first experience working on software and in a startup. For the last 5 months I was the product leader.
About the Sema Maintenance Platform
The platform had seen steady feature improvements since it's initial launch. This included whole new functionality, additional programming language support, more graphs and tables, a reports section. It was intriguing and useful info but overwhelming. There was no flow and users couldn't see clear insights and how best to use this new data in their software development workflow.
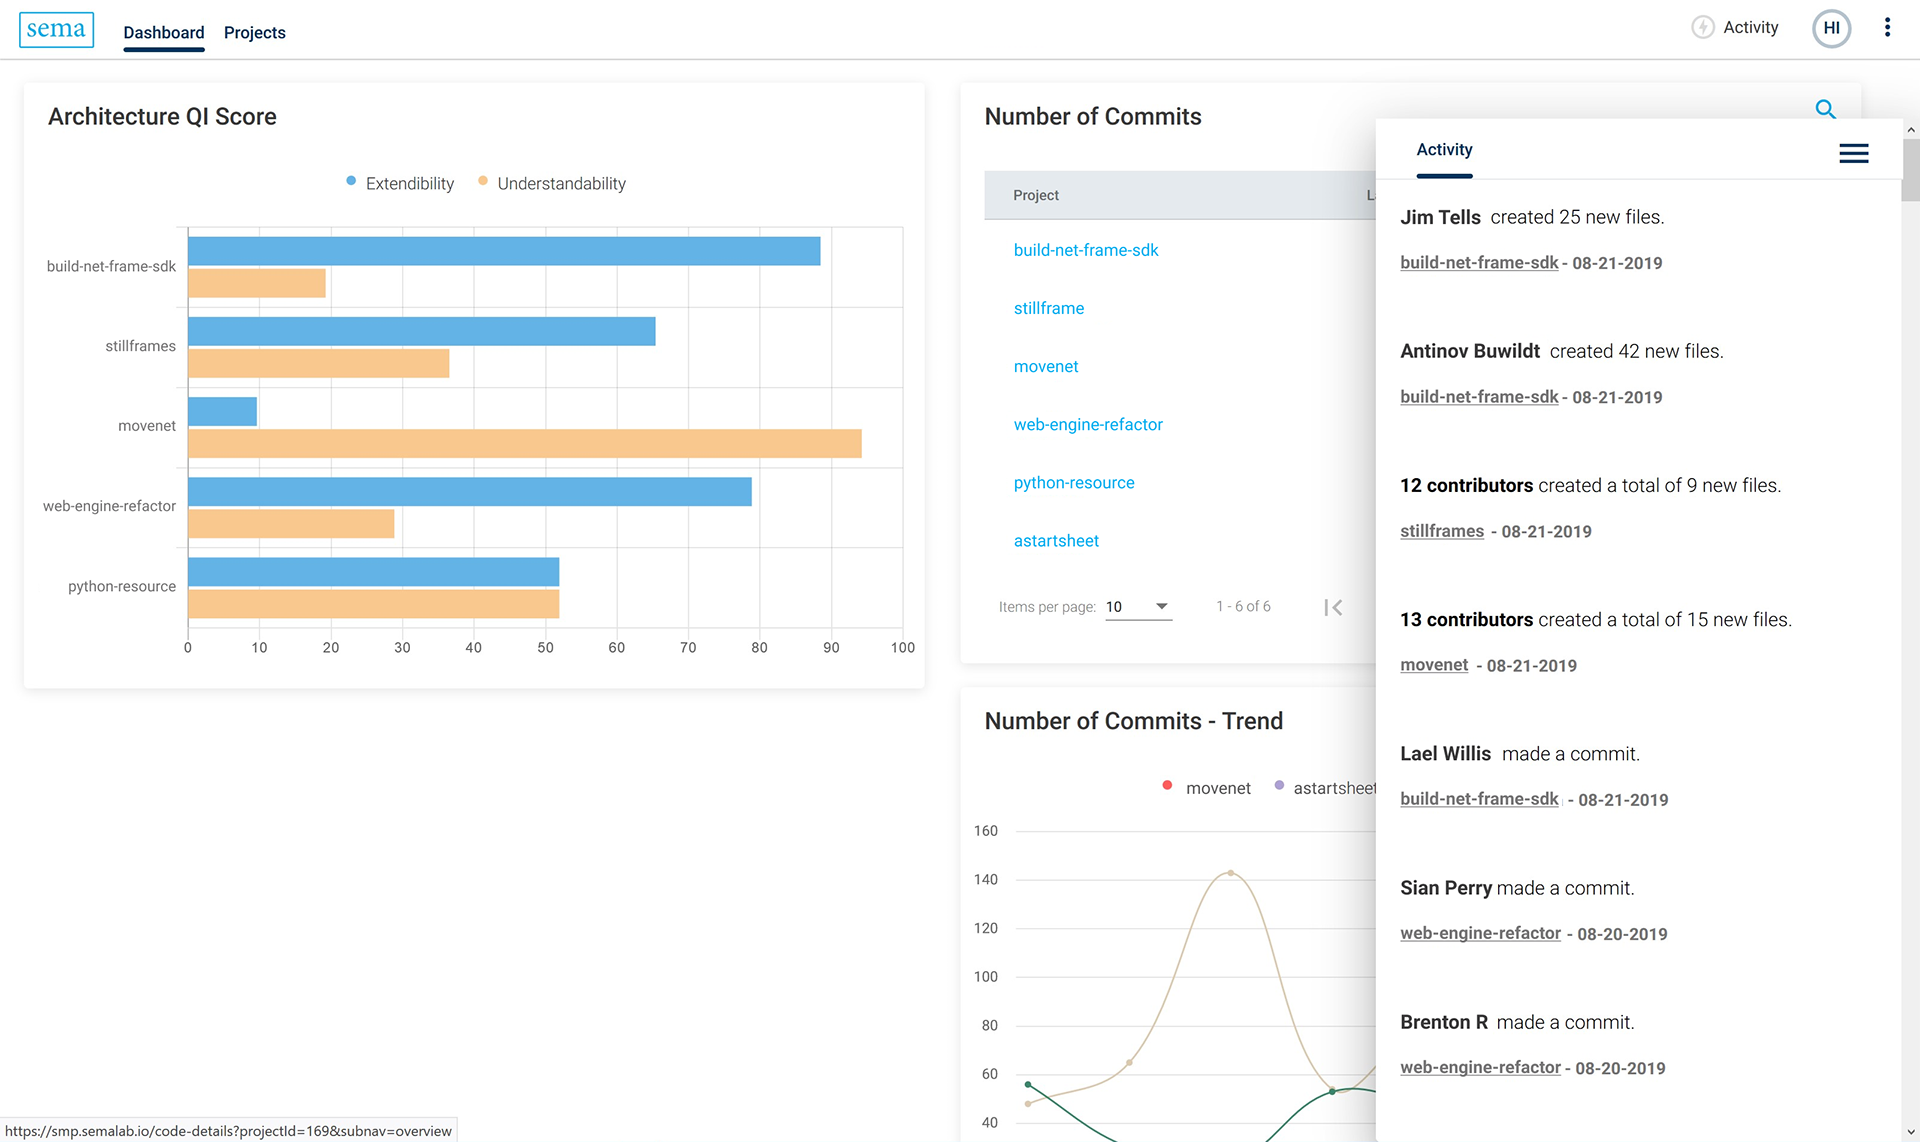
Overview page
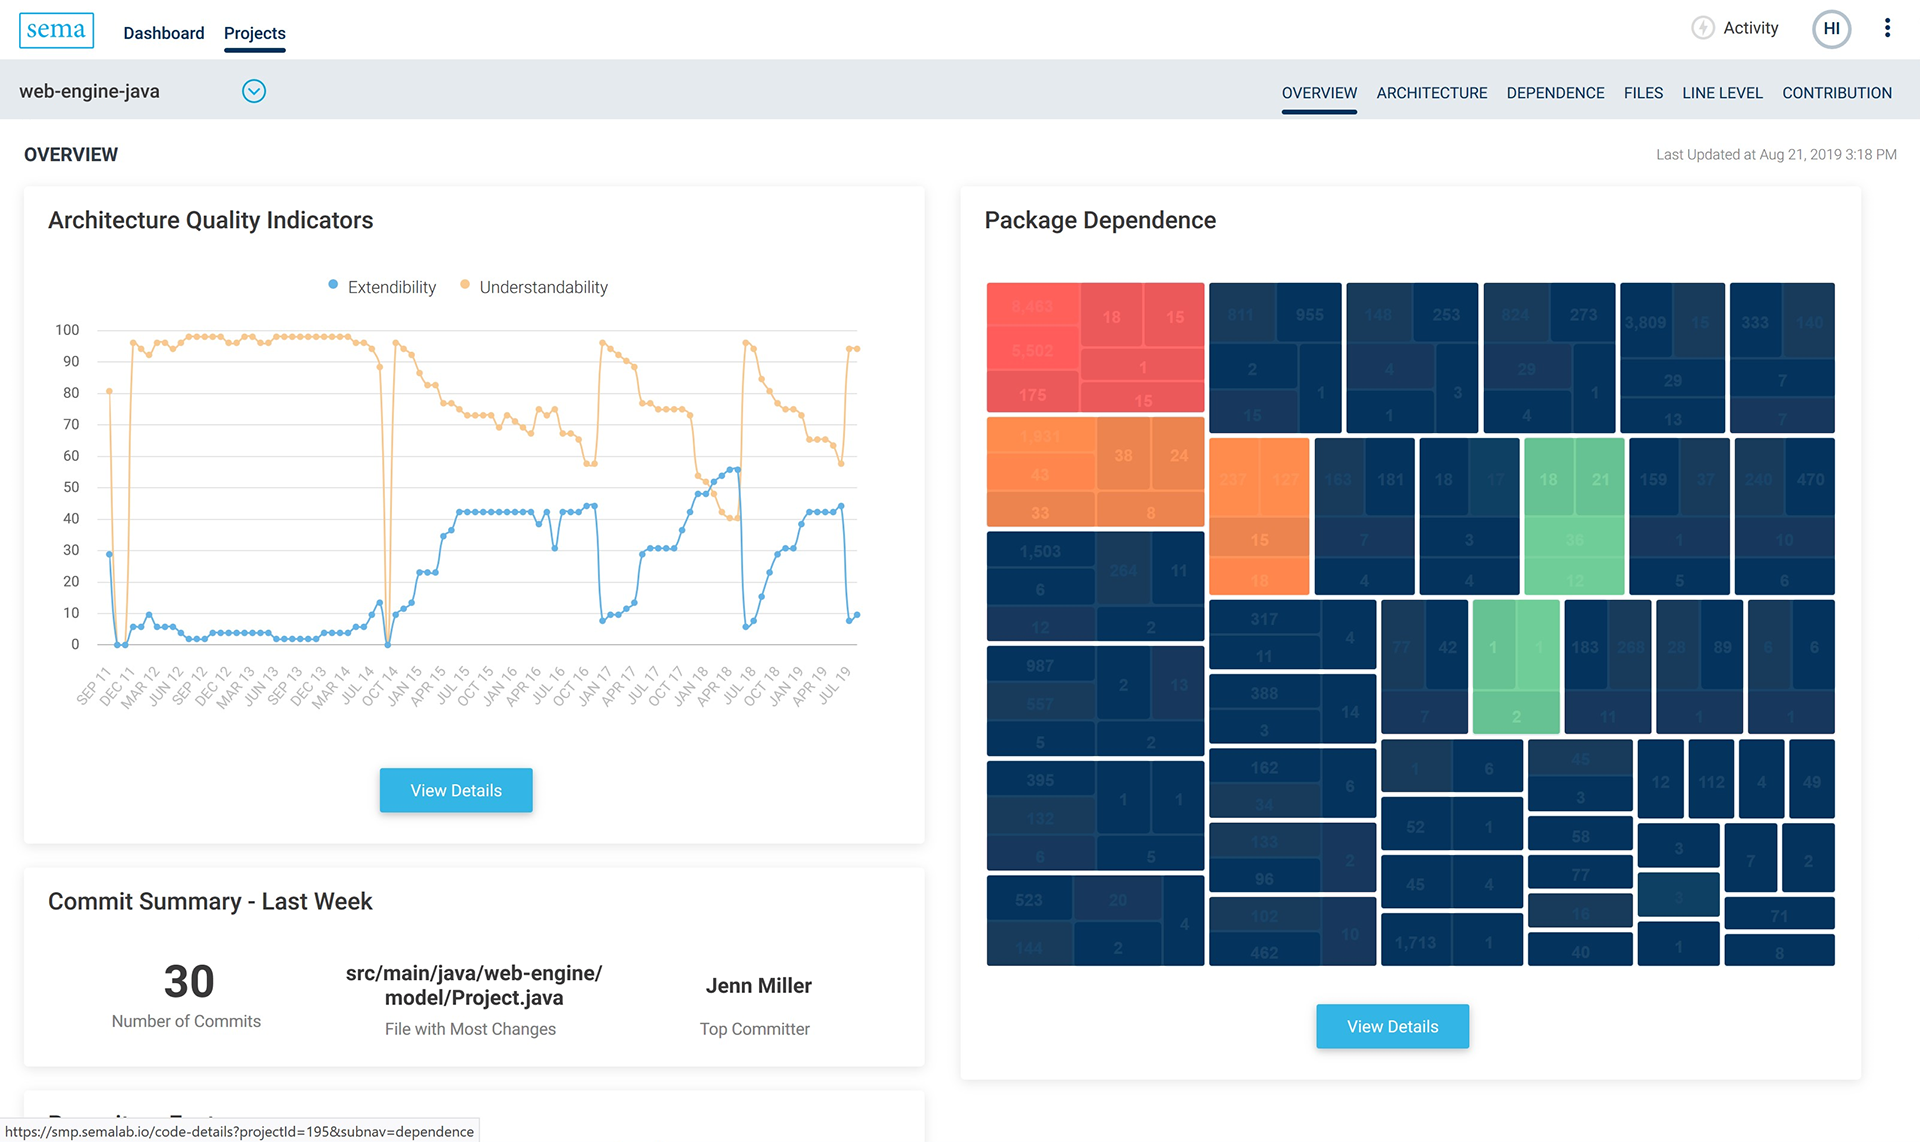
Project overview
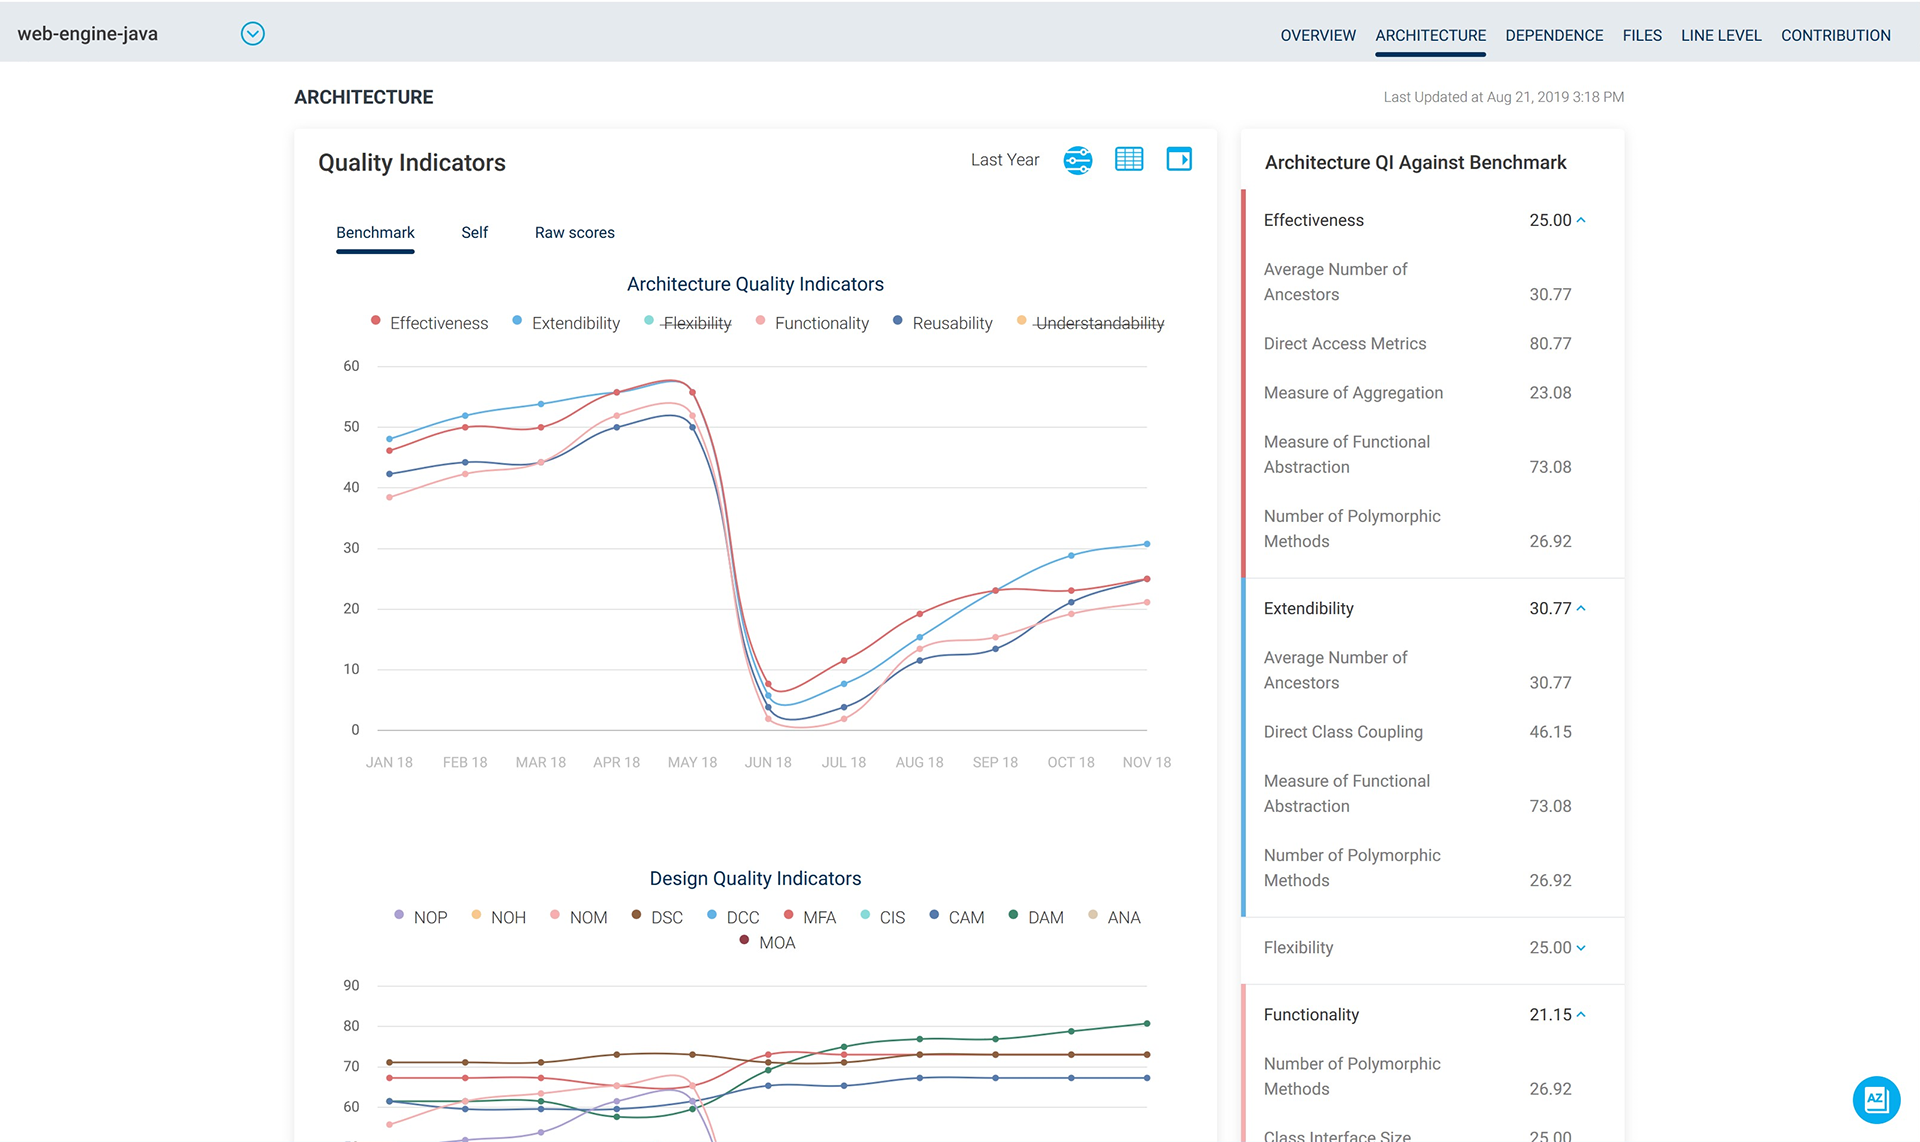
Architecture metrics
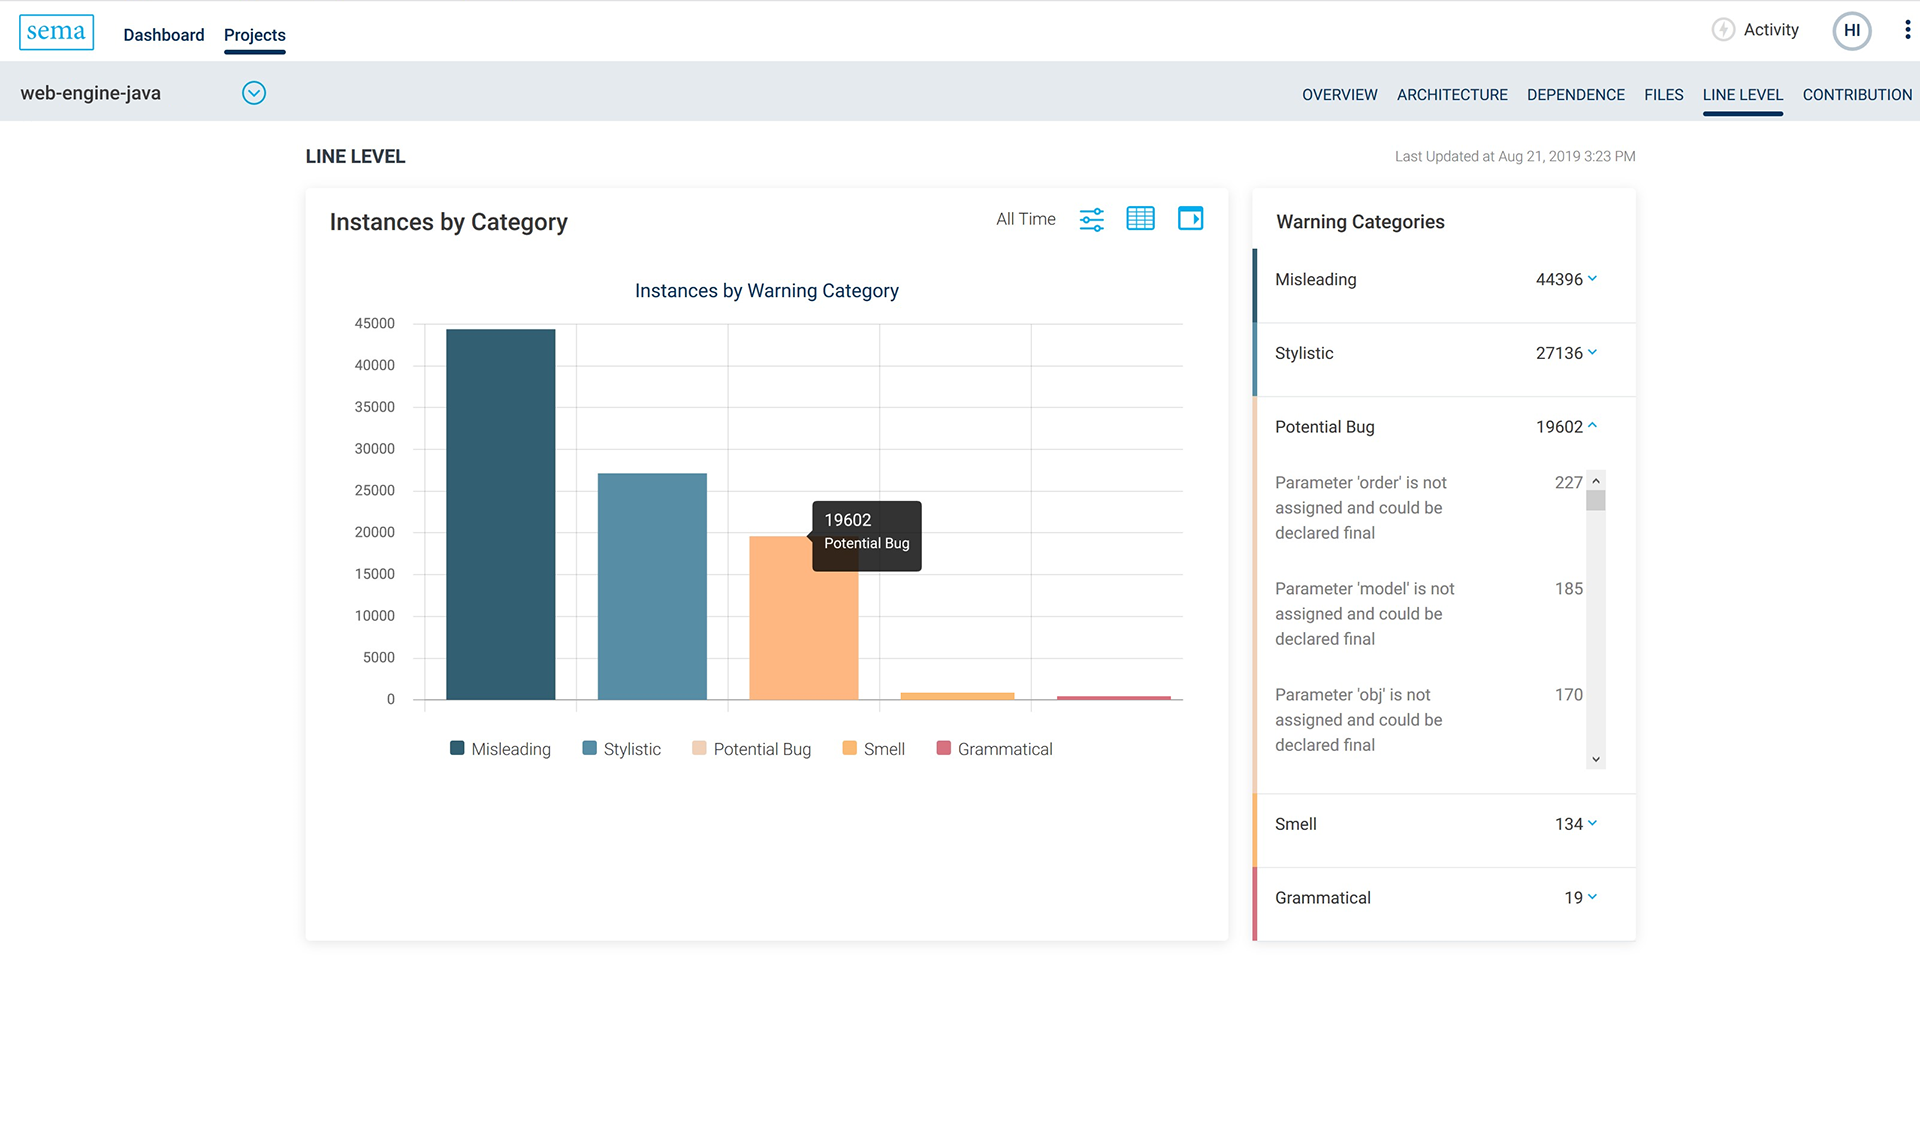
Linter summary
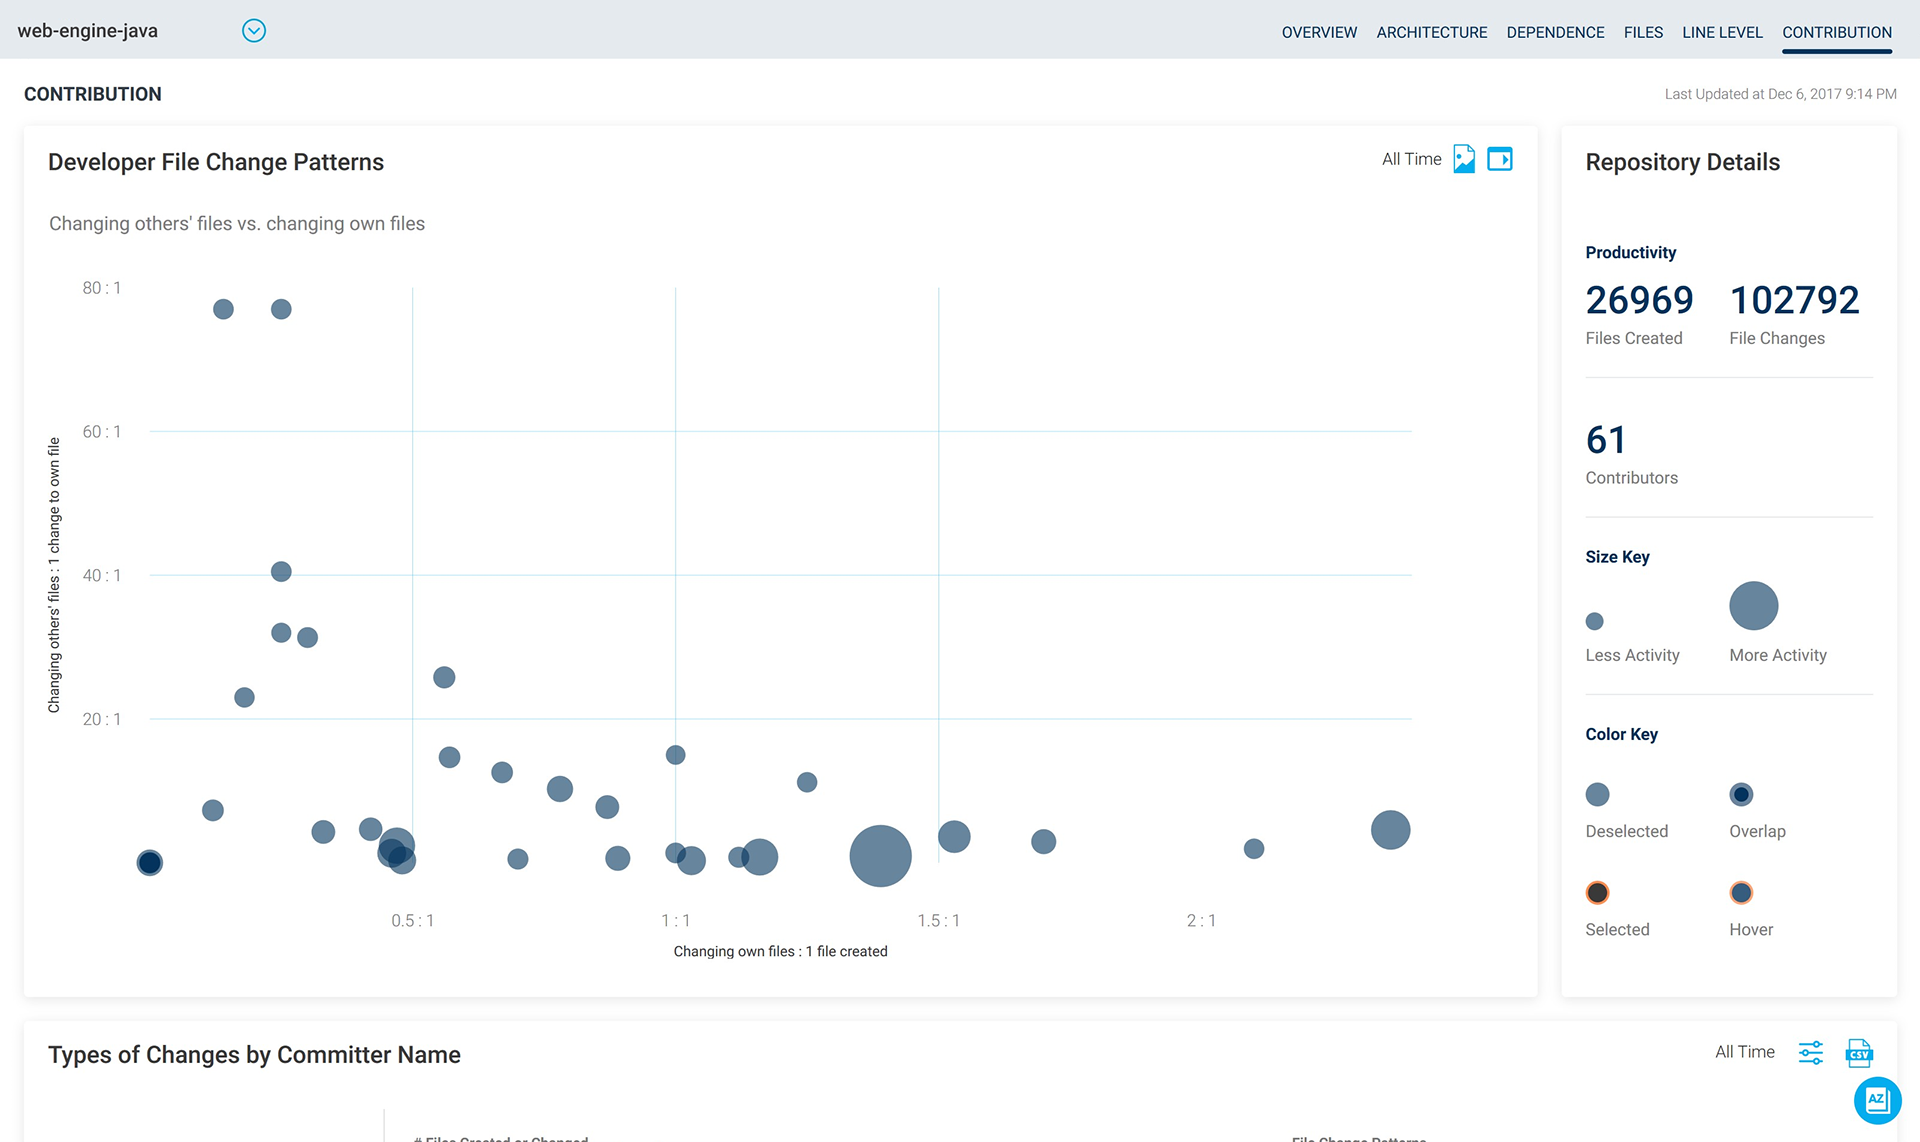
Contribution details
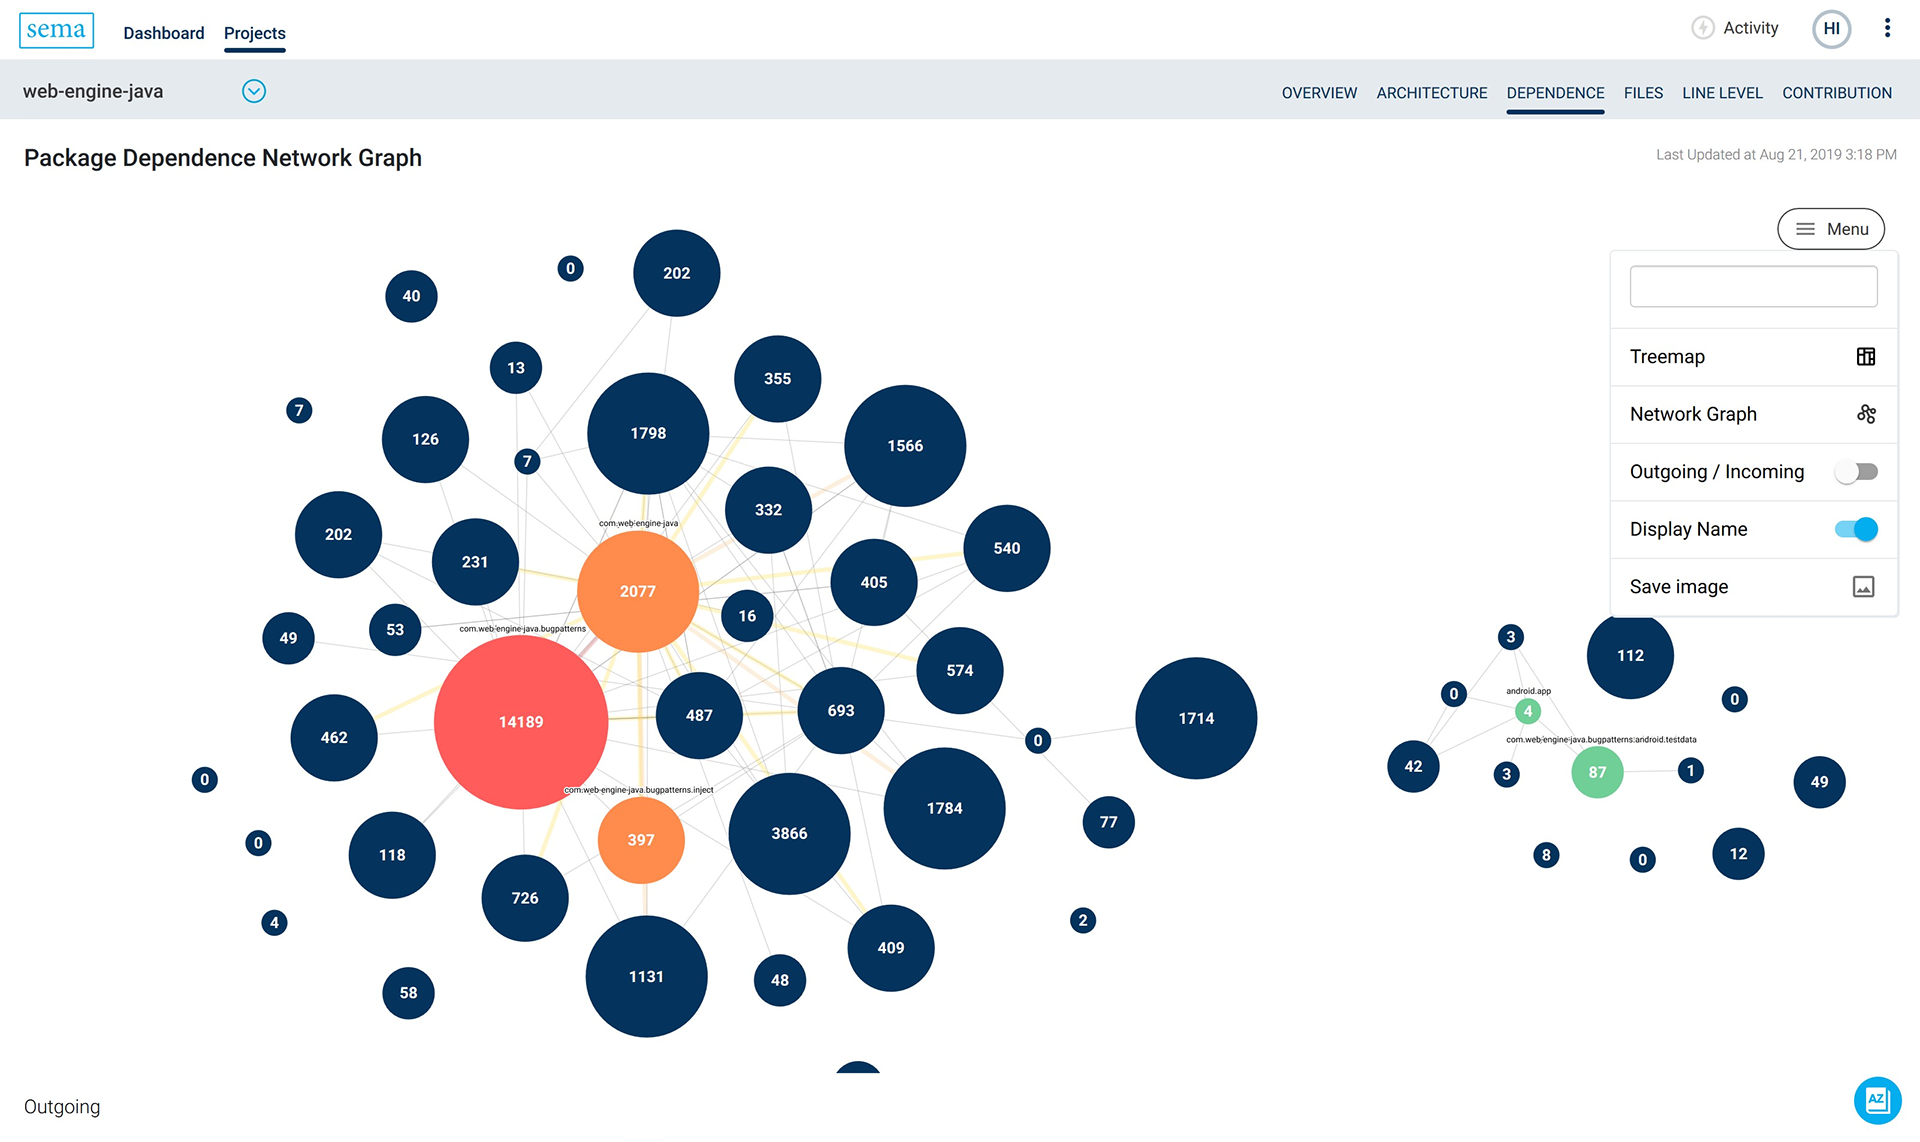
Package dependence browser
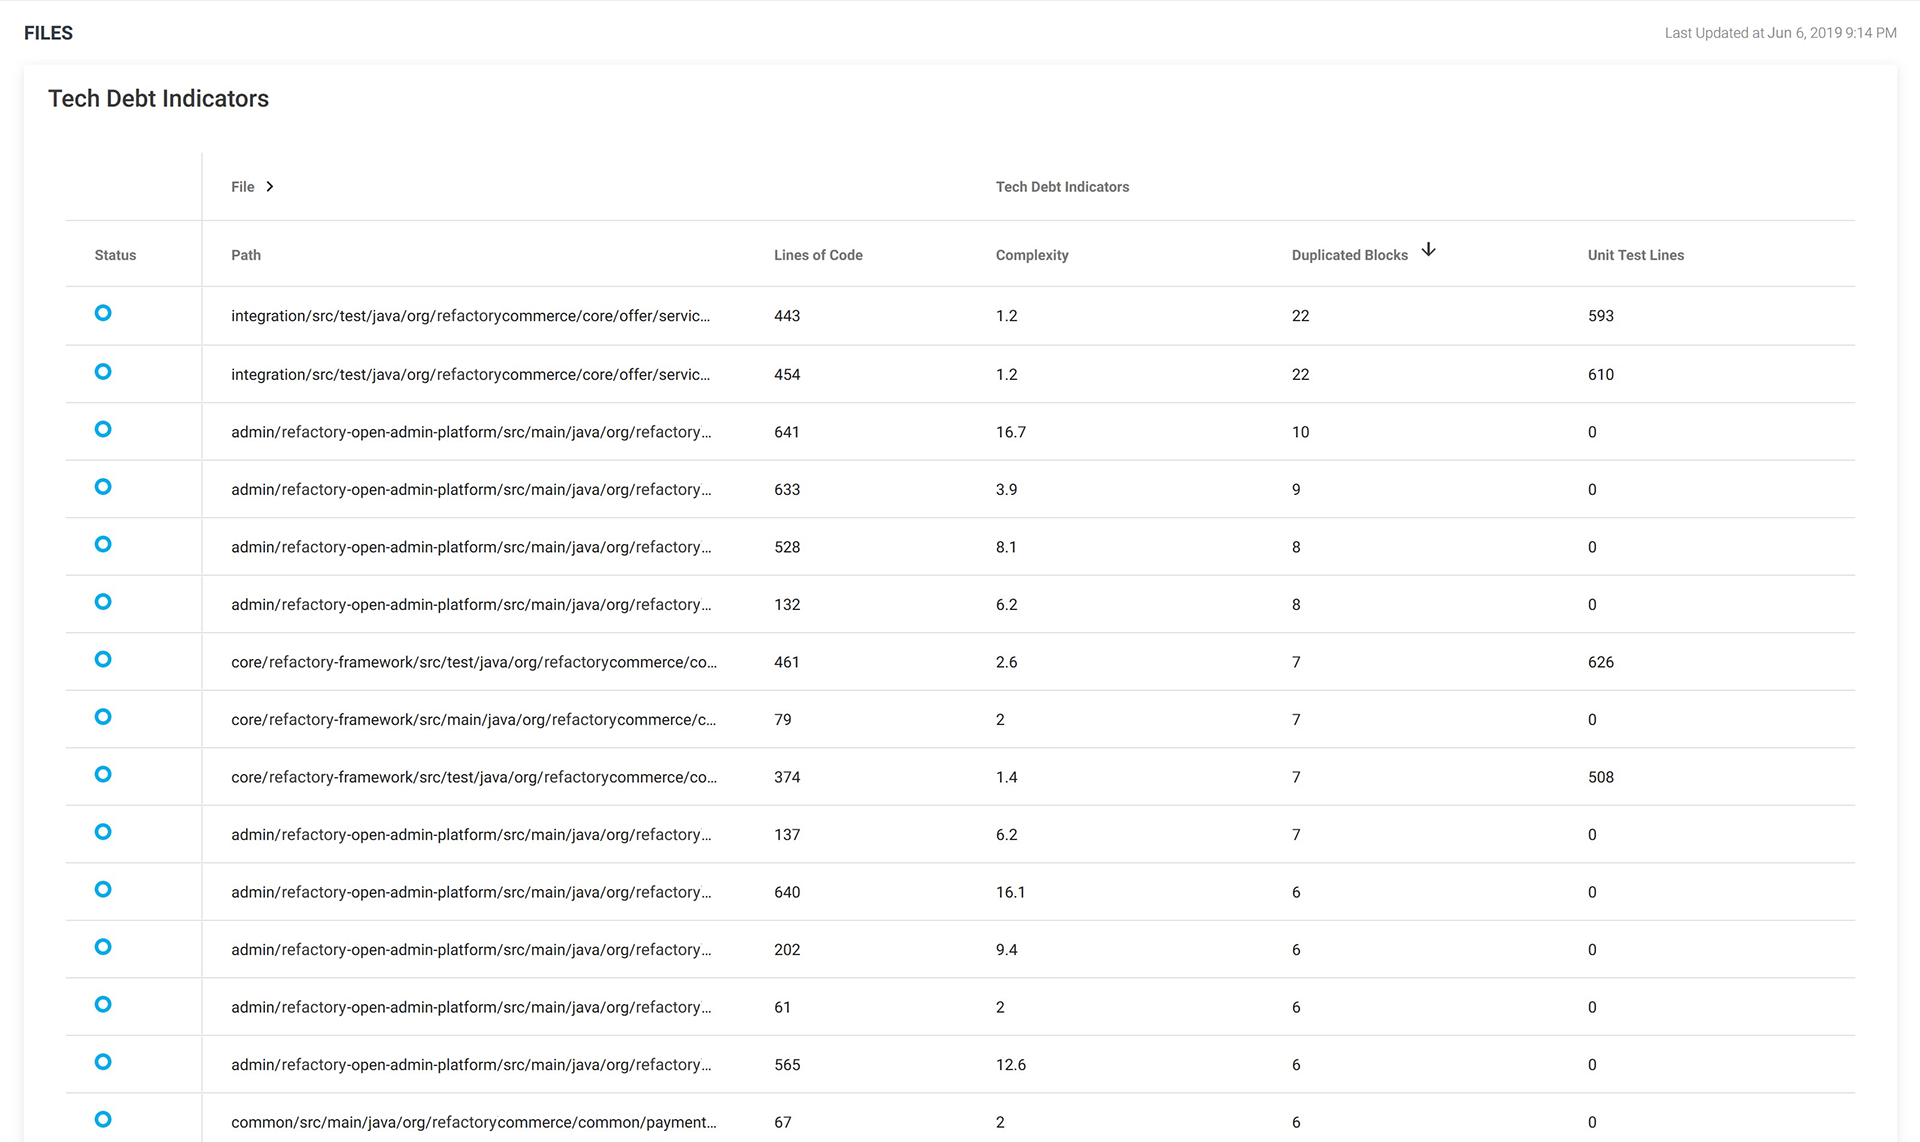
One of many data tables
Enterprise sales of professional services, reports and a web app
Our product service system included targeted reports generated by analysts on the Professional Services team with the support of our researchers. Customer engagements were very hands on, professional services team onboarding users, adding their repositories and performing health checks at about a monthly cadence.
In practice, busy software teams couldn't make time to learn all the metrics and go through the tables and graphs in our product scraping value. Expecting a report and scheduled call to talk through it, clients tended to wait for that rather than spend time in the product. Our analytics showed only a few customers actually checking regularly, and only for short periods.
This impacted the users relationship with the product, and was a labor intensive bottleneck. We had to find a way to productize professional services to replicate the value users were finding in a scalable product.
Three user journeys
To develop the product roadmap, myself & the VP of Product mapped out 3 overarching user journeys based on feedback from the pilot, early demos and interviews.
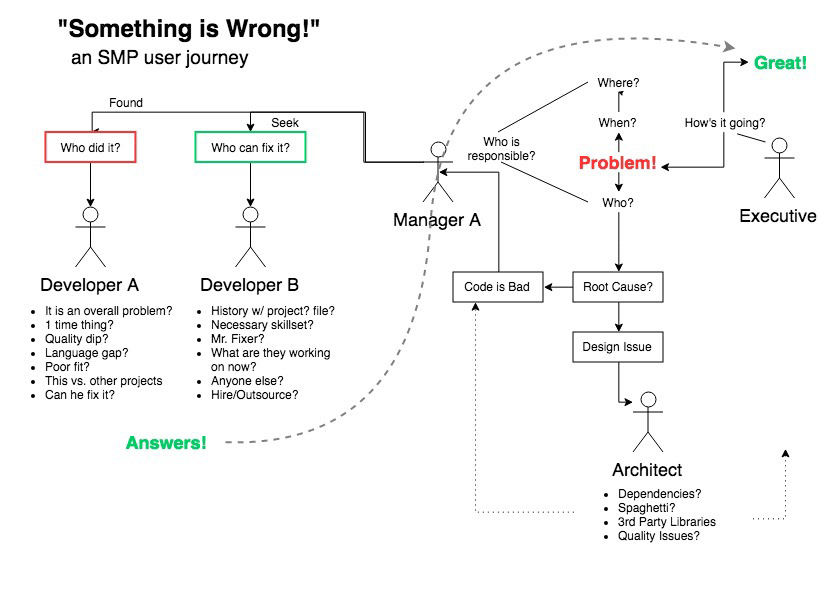
Analytics alone doesn't show connections and context
As an product manager I spent a great deal of time learning from engineering and research how our database was structured and how different datapoints and metrics were connected. Much more than a user might guess by looking at the product interface, where deep data is spread thin across pages.
There was no continuity, and the places people expected they could click and drill down didn't do anything of the sort. I started trying to string together data so users could explore it in any direction.
Balsamiq wireframe (~3 months in the role)
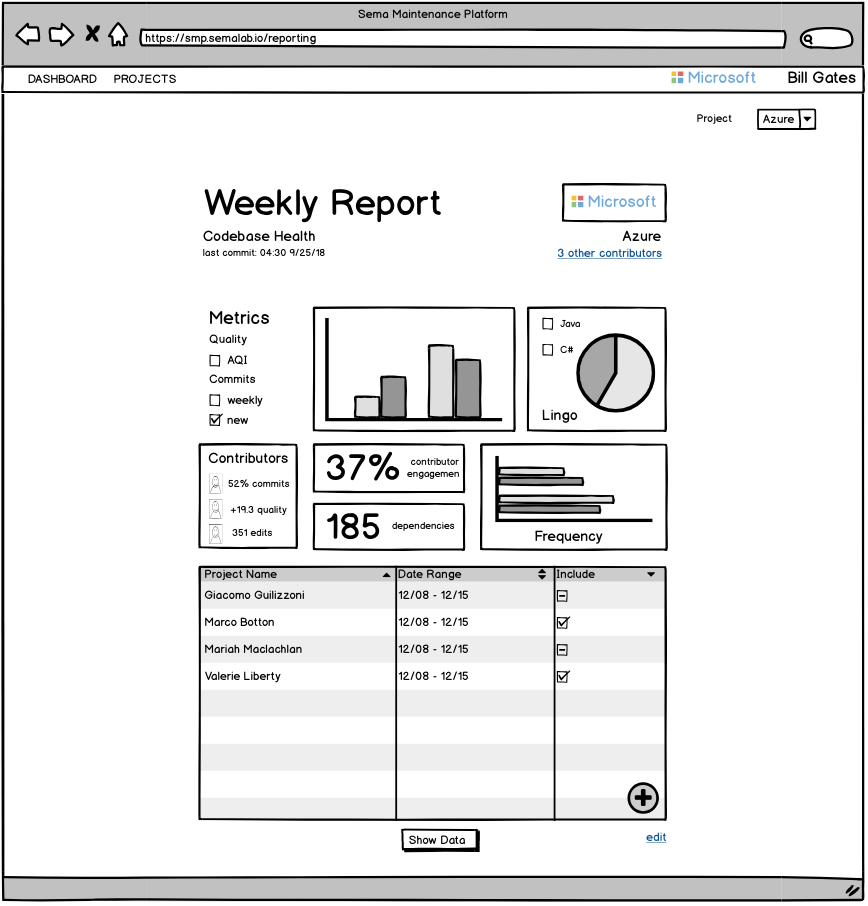
A simple user journey illustrating how a user might click through data.
Weekly report shows an unusual increase in Javascript files →
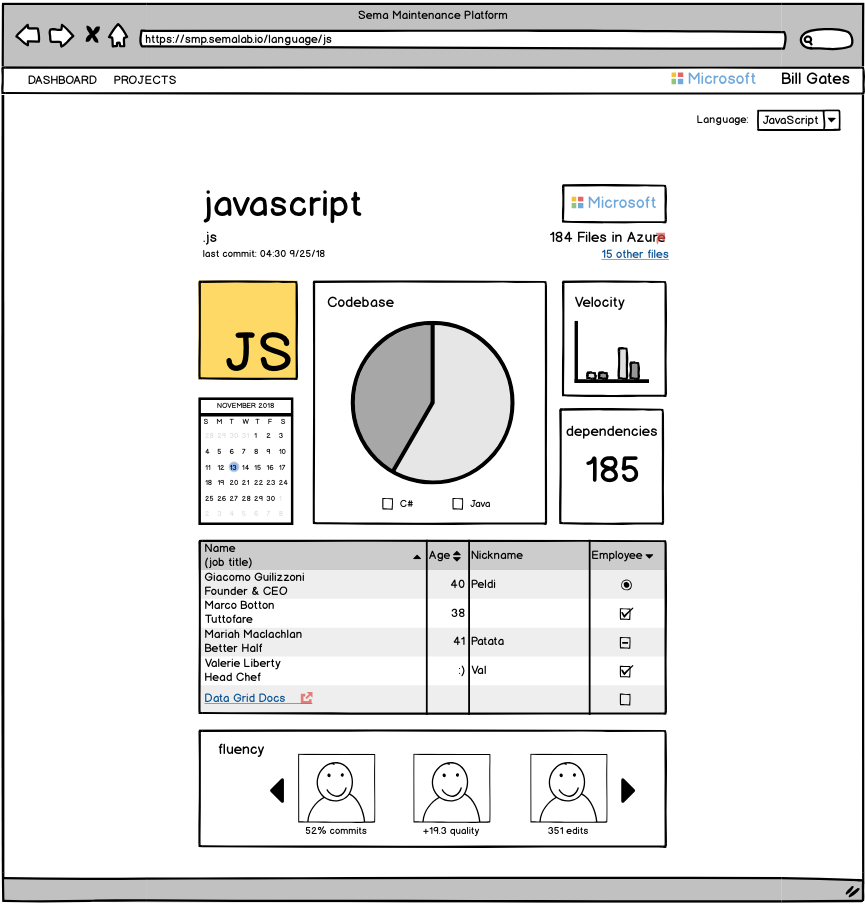
Drill into Javascript to see a large new package has been imported →
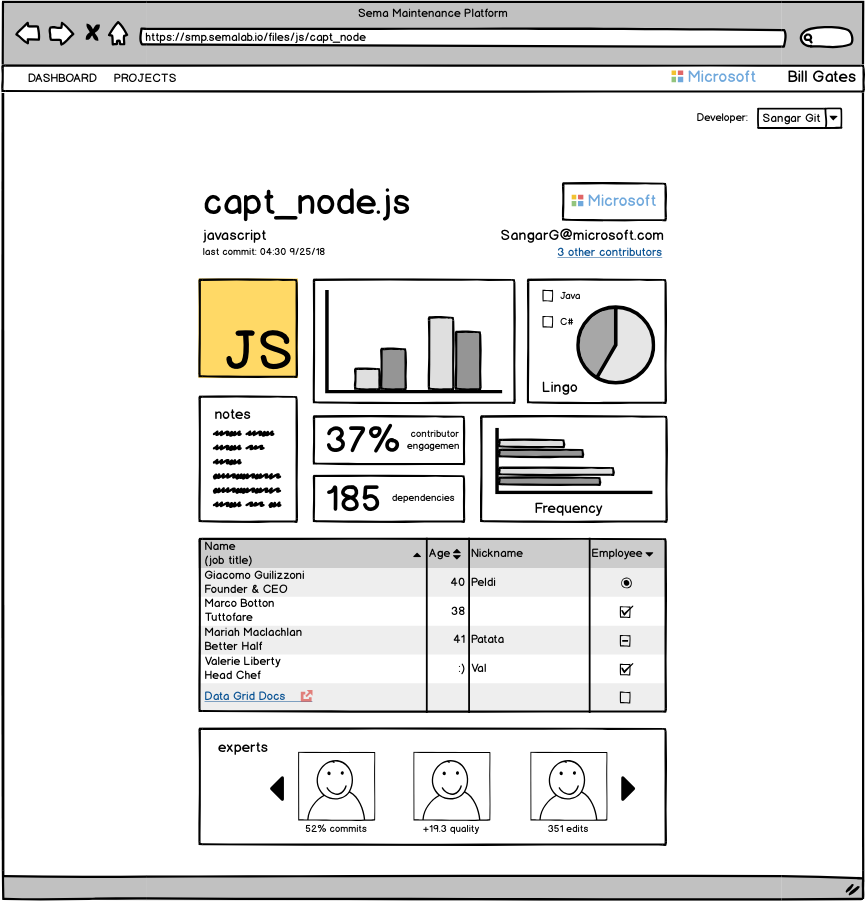
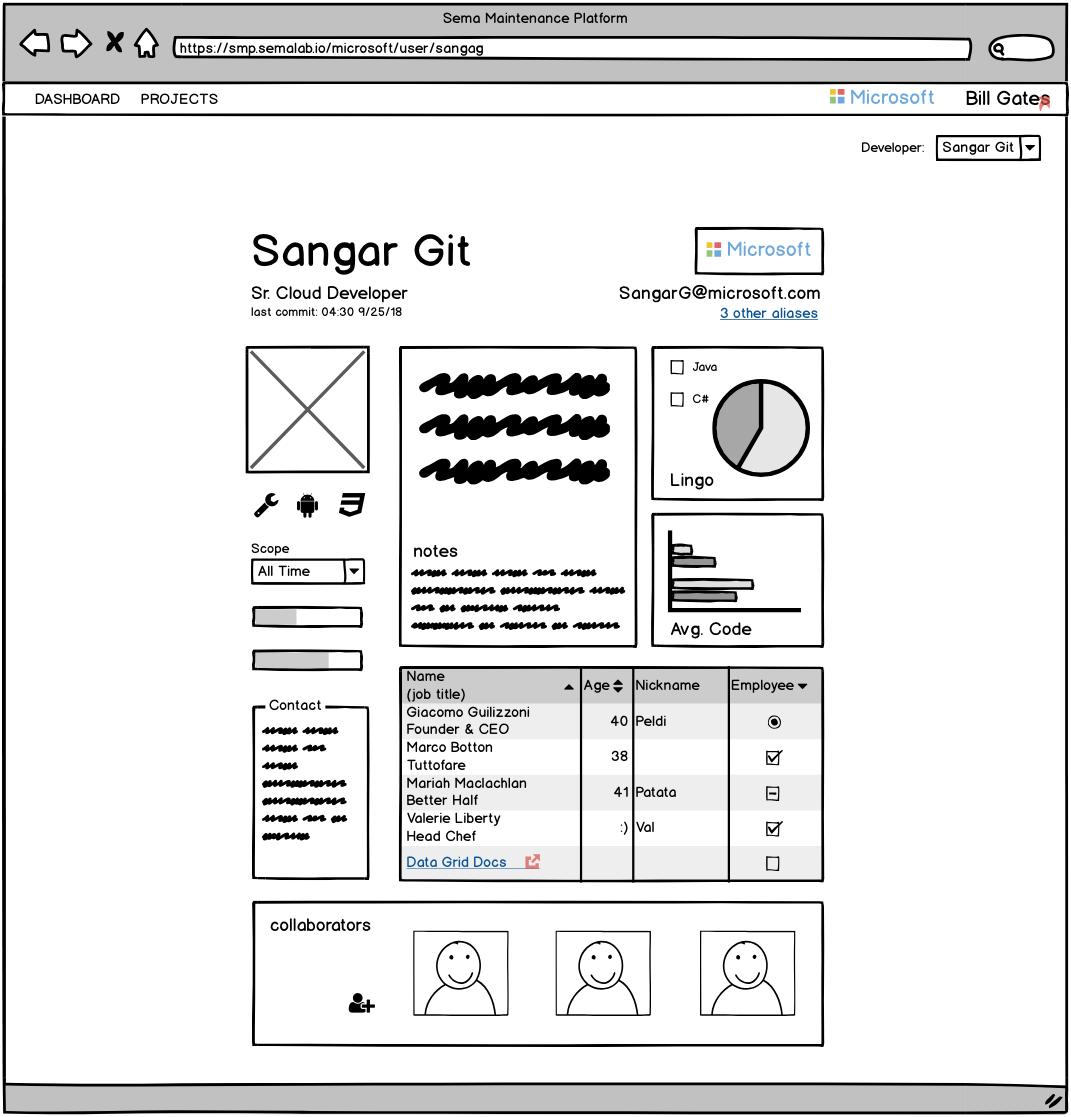
Look into package capt_node.js and see who is working on it →
Follow up with the developer or manager tied to that package.
Drill into Javascript to see a large new package has been imported →
Look into package capt_node.js and see who is working on it →
Follow up with the developer or manager tied to that package.
Feedback from product and professional services teams lead to an important insight; our data structure and platform weren't supporting users with contextual exploration.
Sema Modal (~8 months in the role)
Thinking about building simpler things that are easier to maintain, I mapped out potential data points presented as a single modal. Without resolving any of the details on these screens, I added to a growing list of contexts or data points we could create for users.
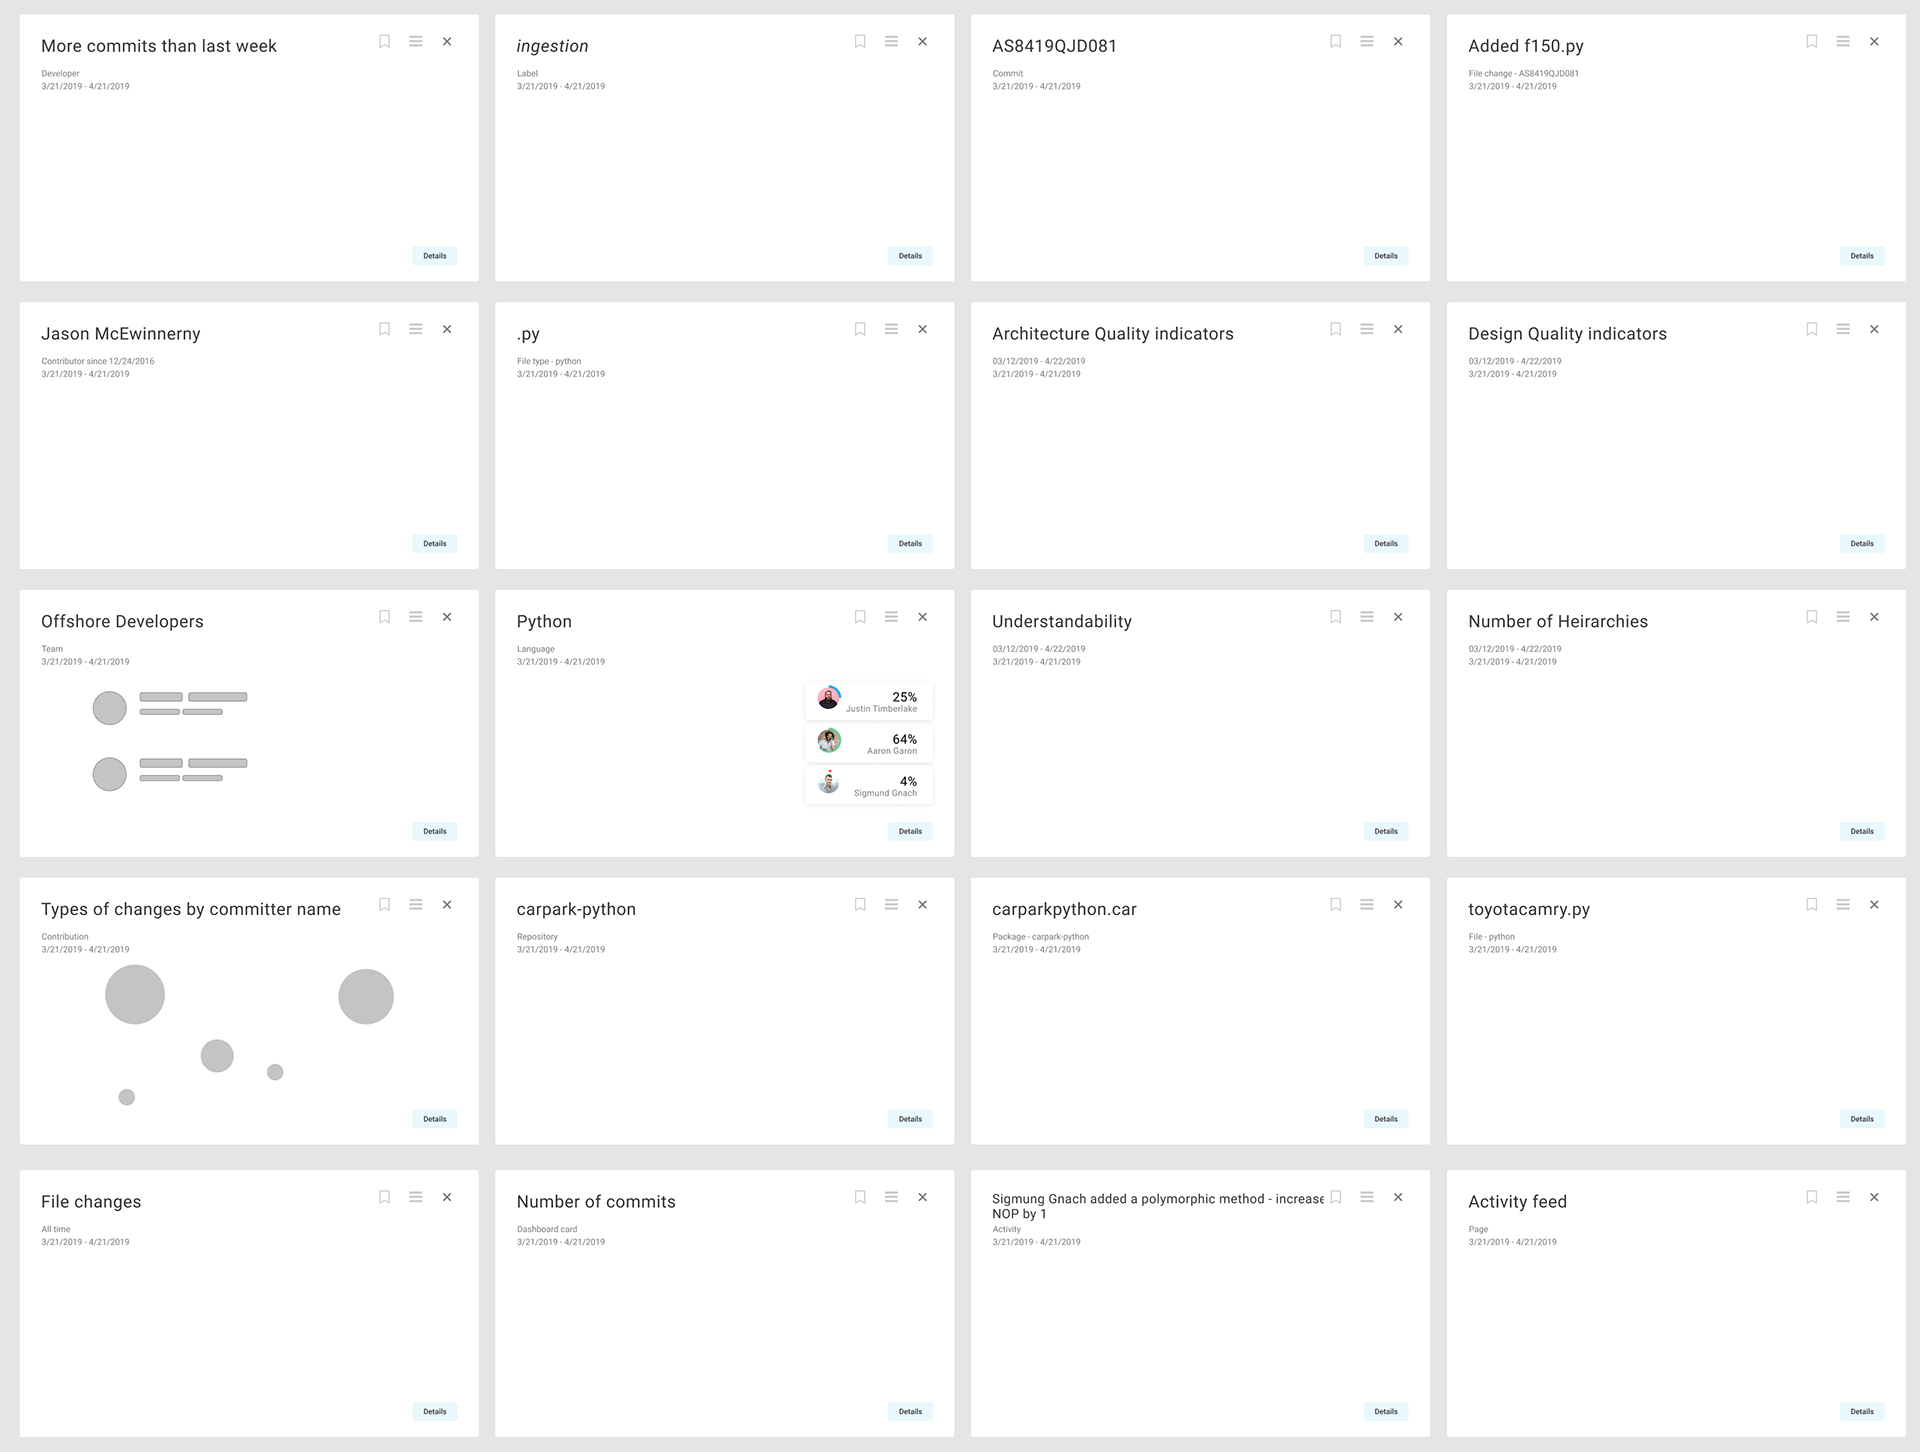
Contextual modals could be used to look at activities, analytics reports, teams, languages, files, commits, etc.
This prototype didn't go any further, but built understanding on how users might wish to drill in and switch focal points, which was not possible in the current product.
Shared vision (~18 months in the role)
We had consensus that a new product experience was needed to provide real value to busy software teams. This thinking was supported by close collaboration and discussions with the professional services, engineering and research teams.
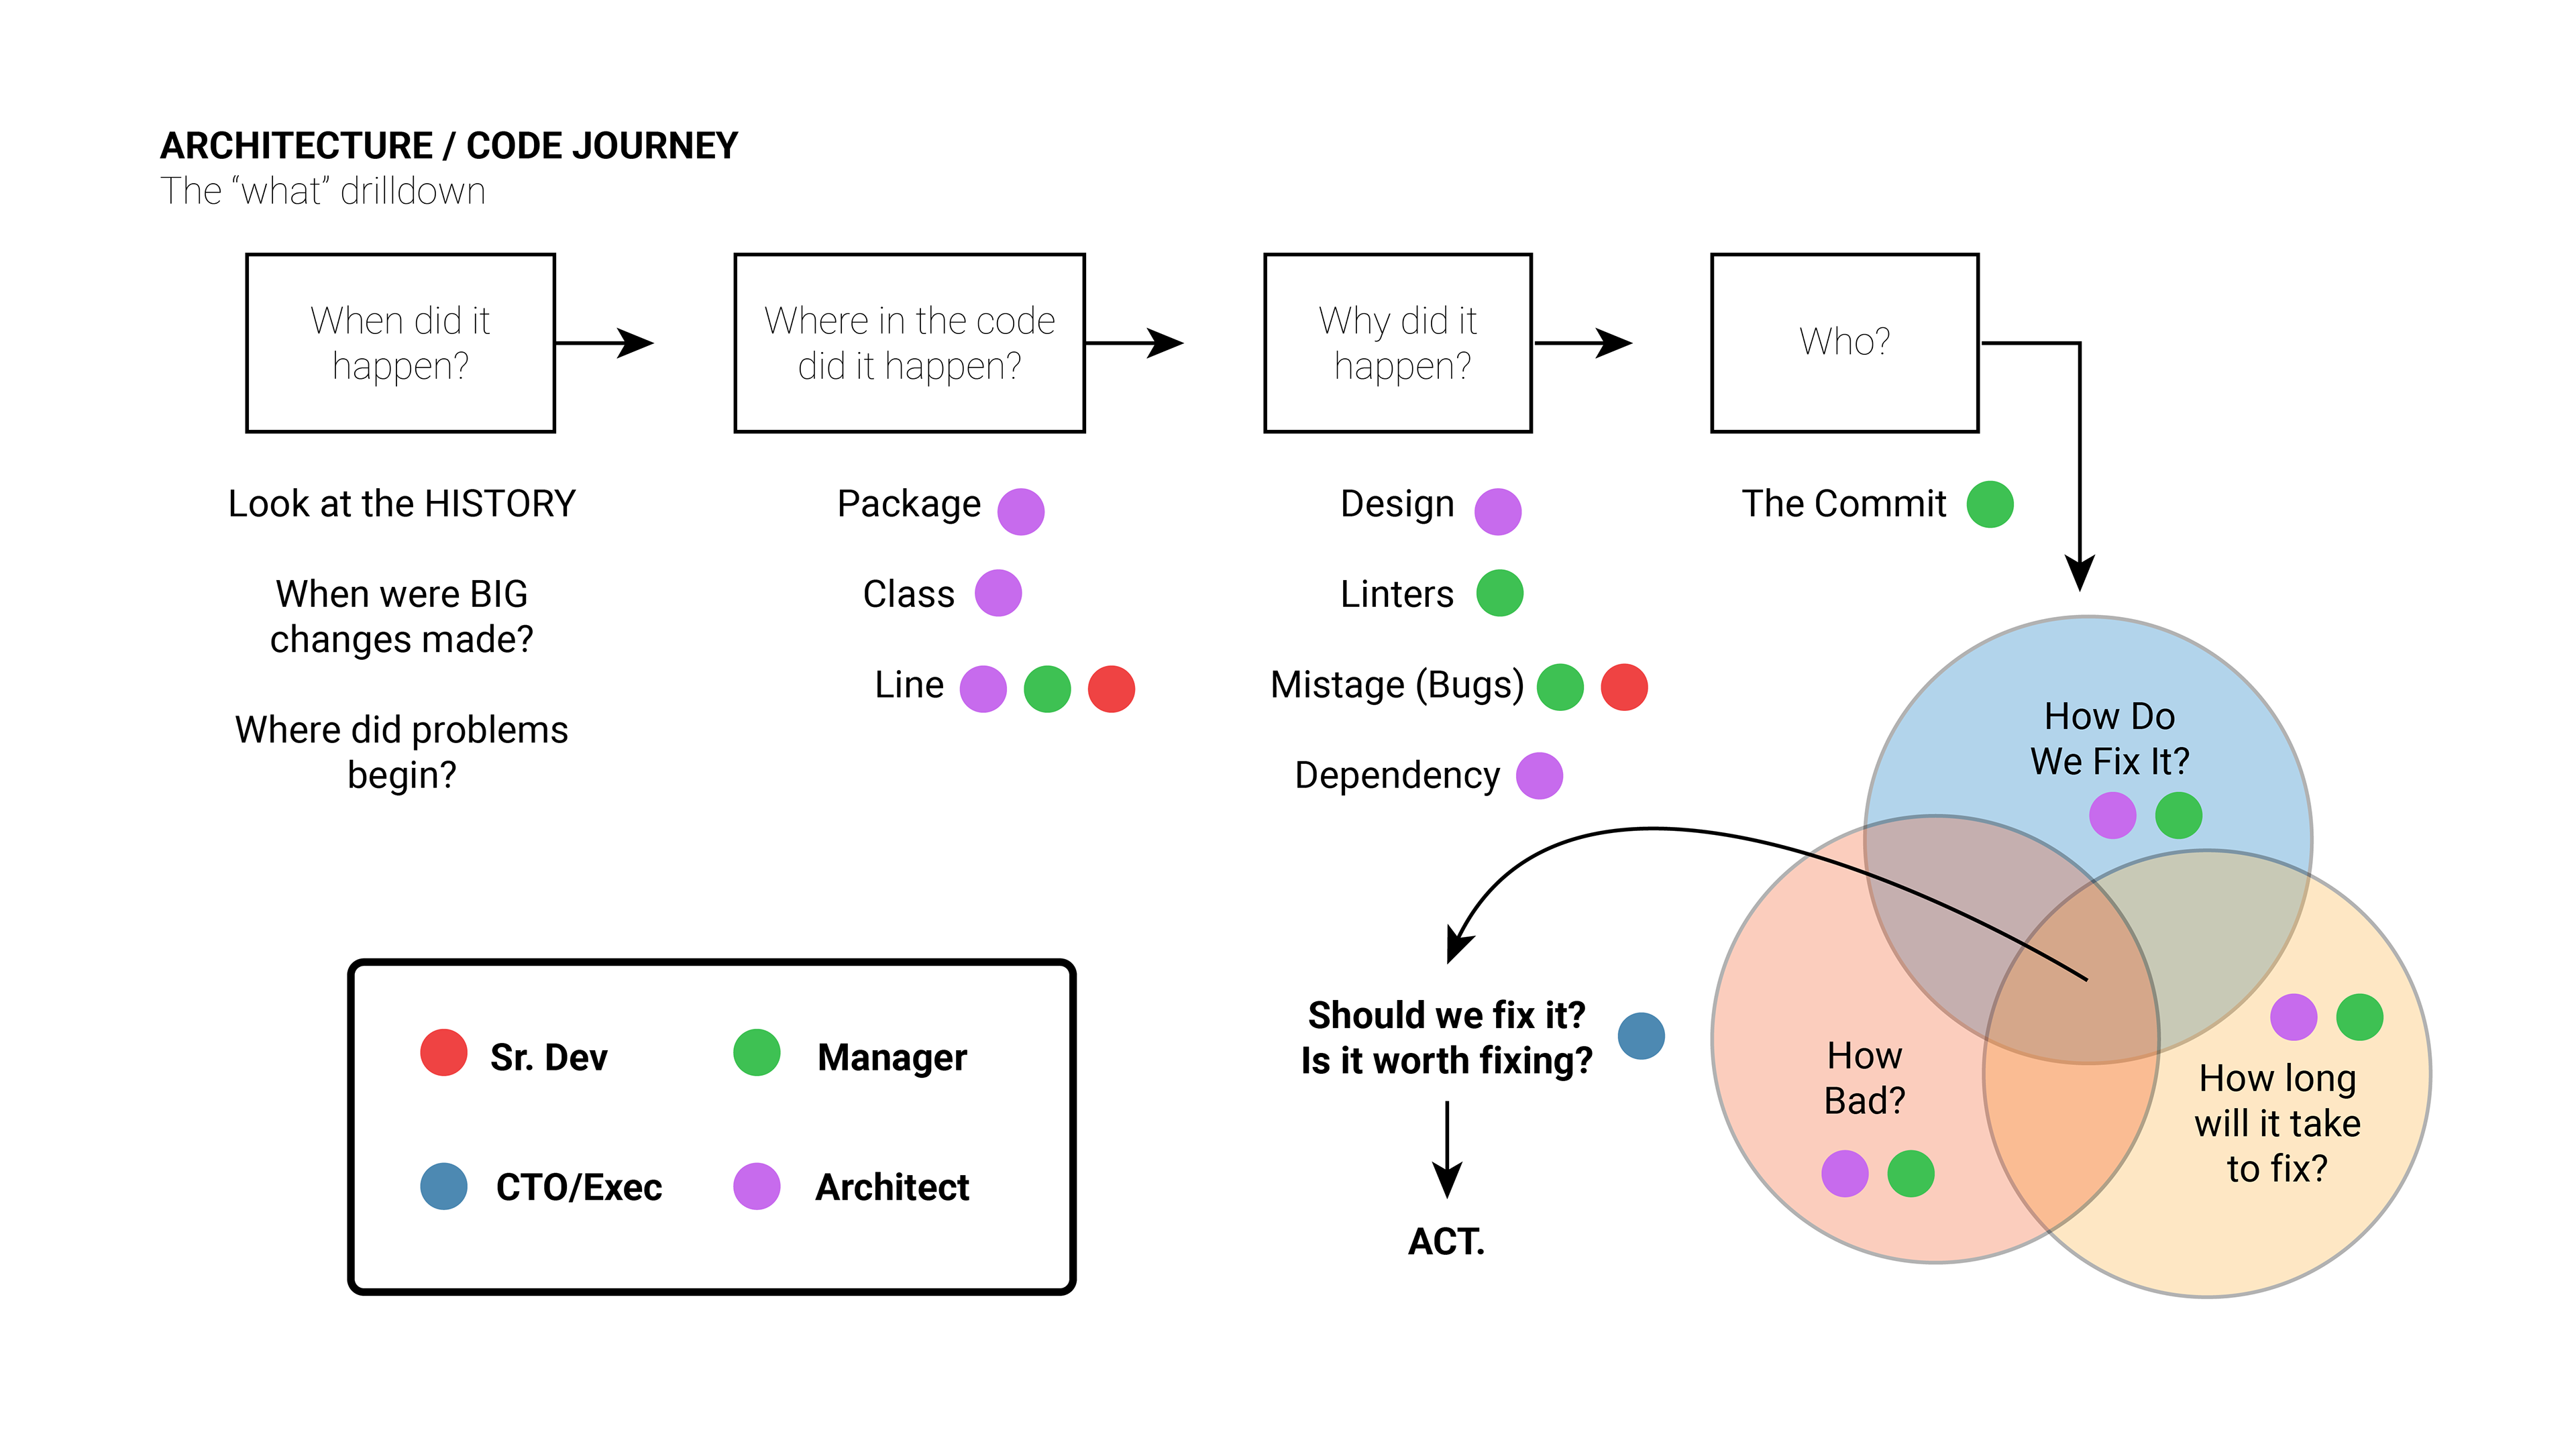
Onboarding new Product Management and Design contractors was a chance to organize learnings into an outline of the underlying information architecture as I'd come to see it.
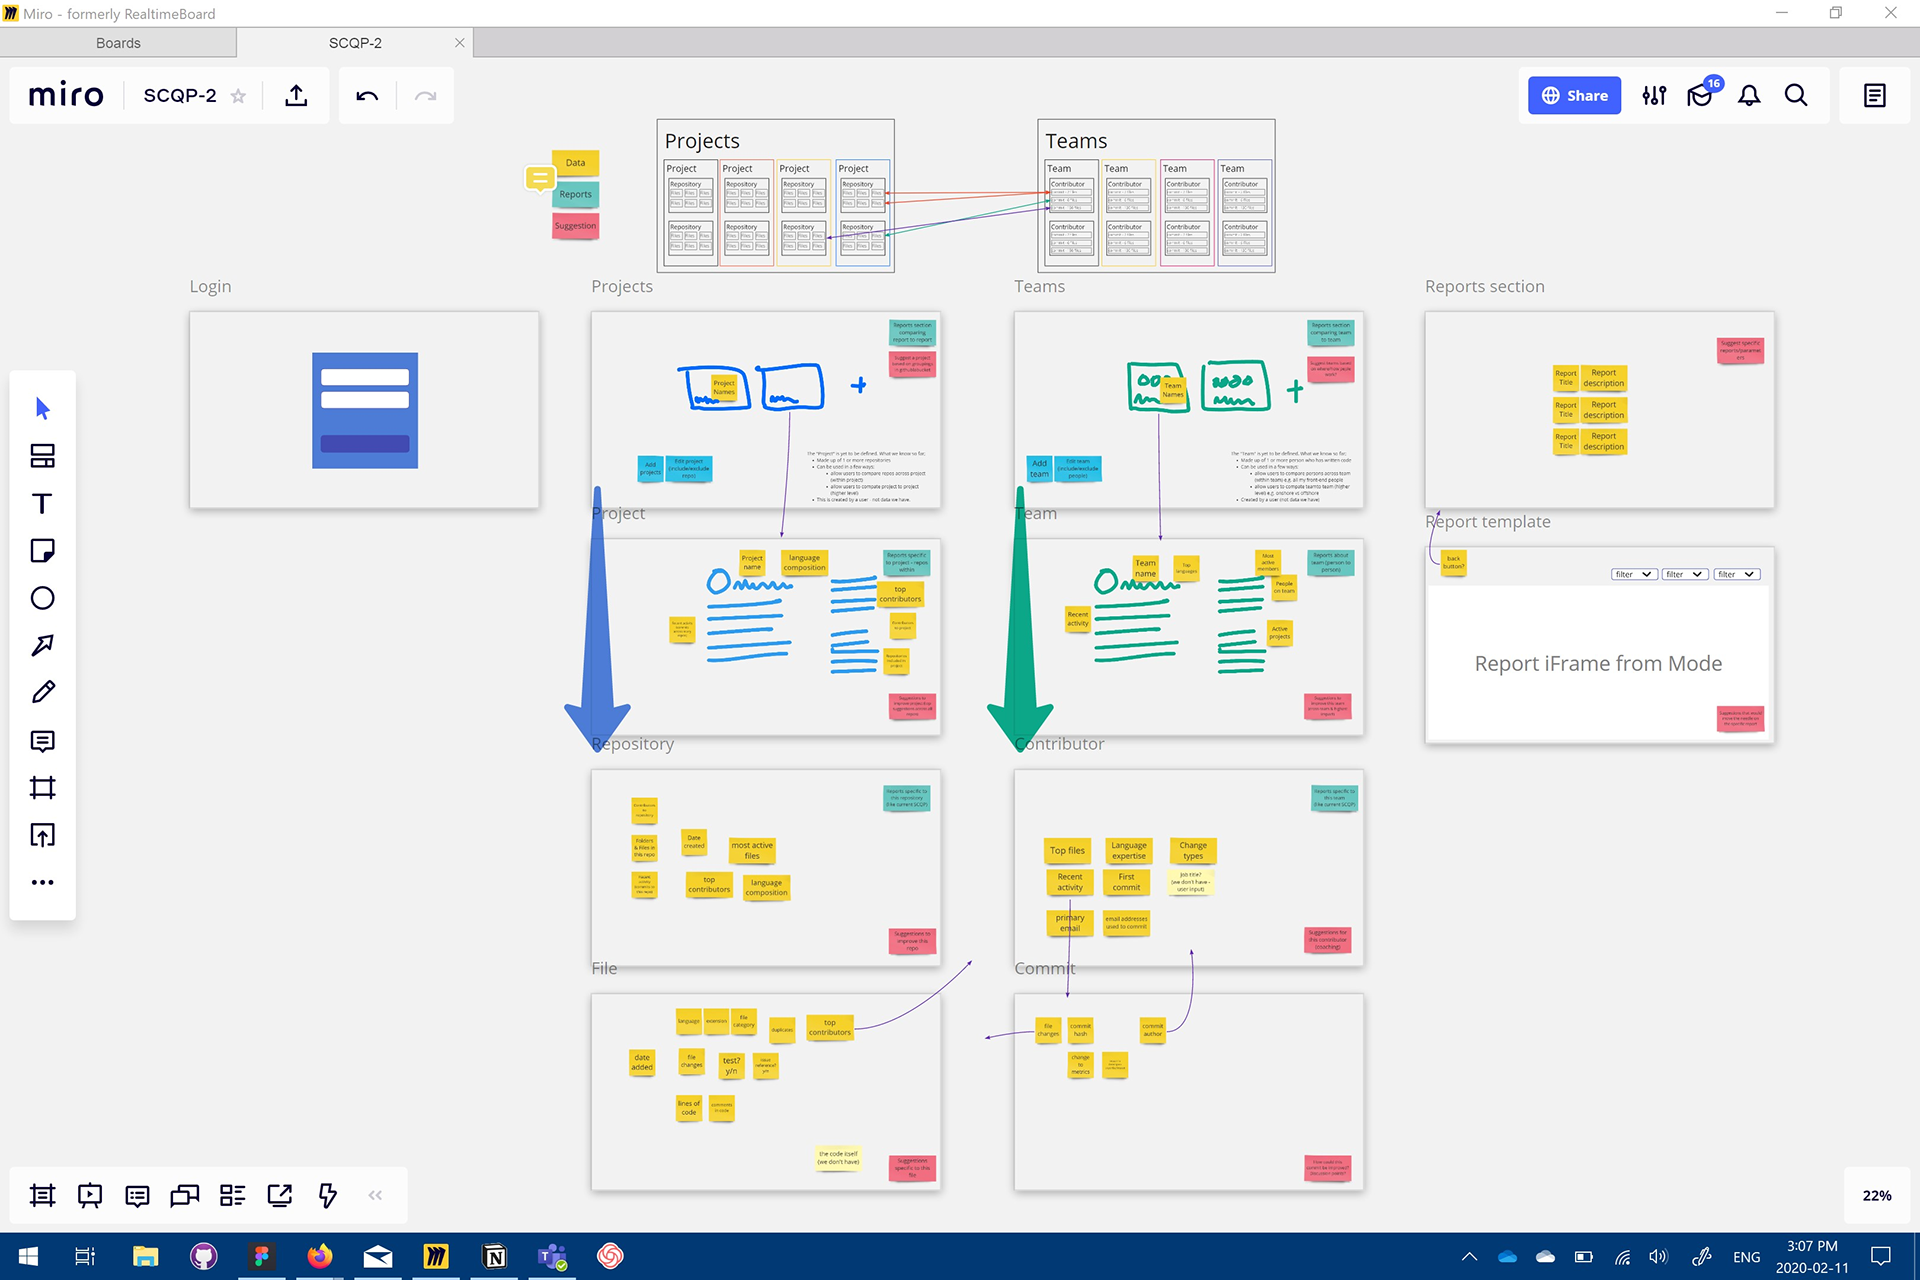
Establishing parallels between code (projects → file) and people (teams → commit)
The two middle columns show the analogous hierarchy of projects and teams. The Project and Team layers would be an organizational layer created by users in our product, and not in the code itself. A repository can belong to multiple projects, just as contributors can belong to multiple teams.
Potential data within context is shown with yellow notes
Contextual report is described with teal notes
Contextual suggestions shown with pink notes
Contextual report is described with teal notes
Contextual suggestions shown with pink notes
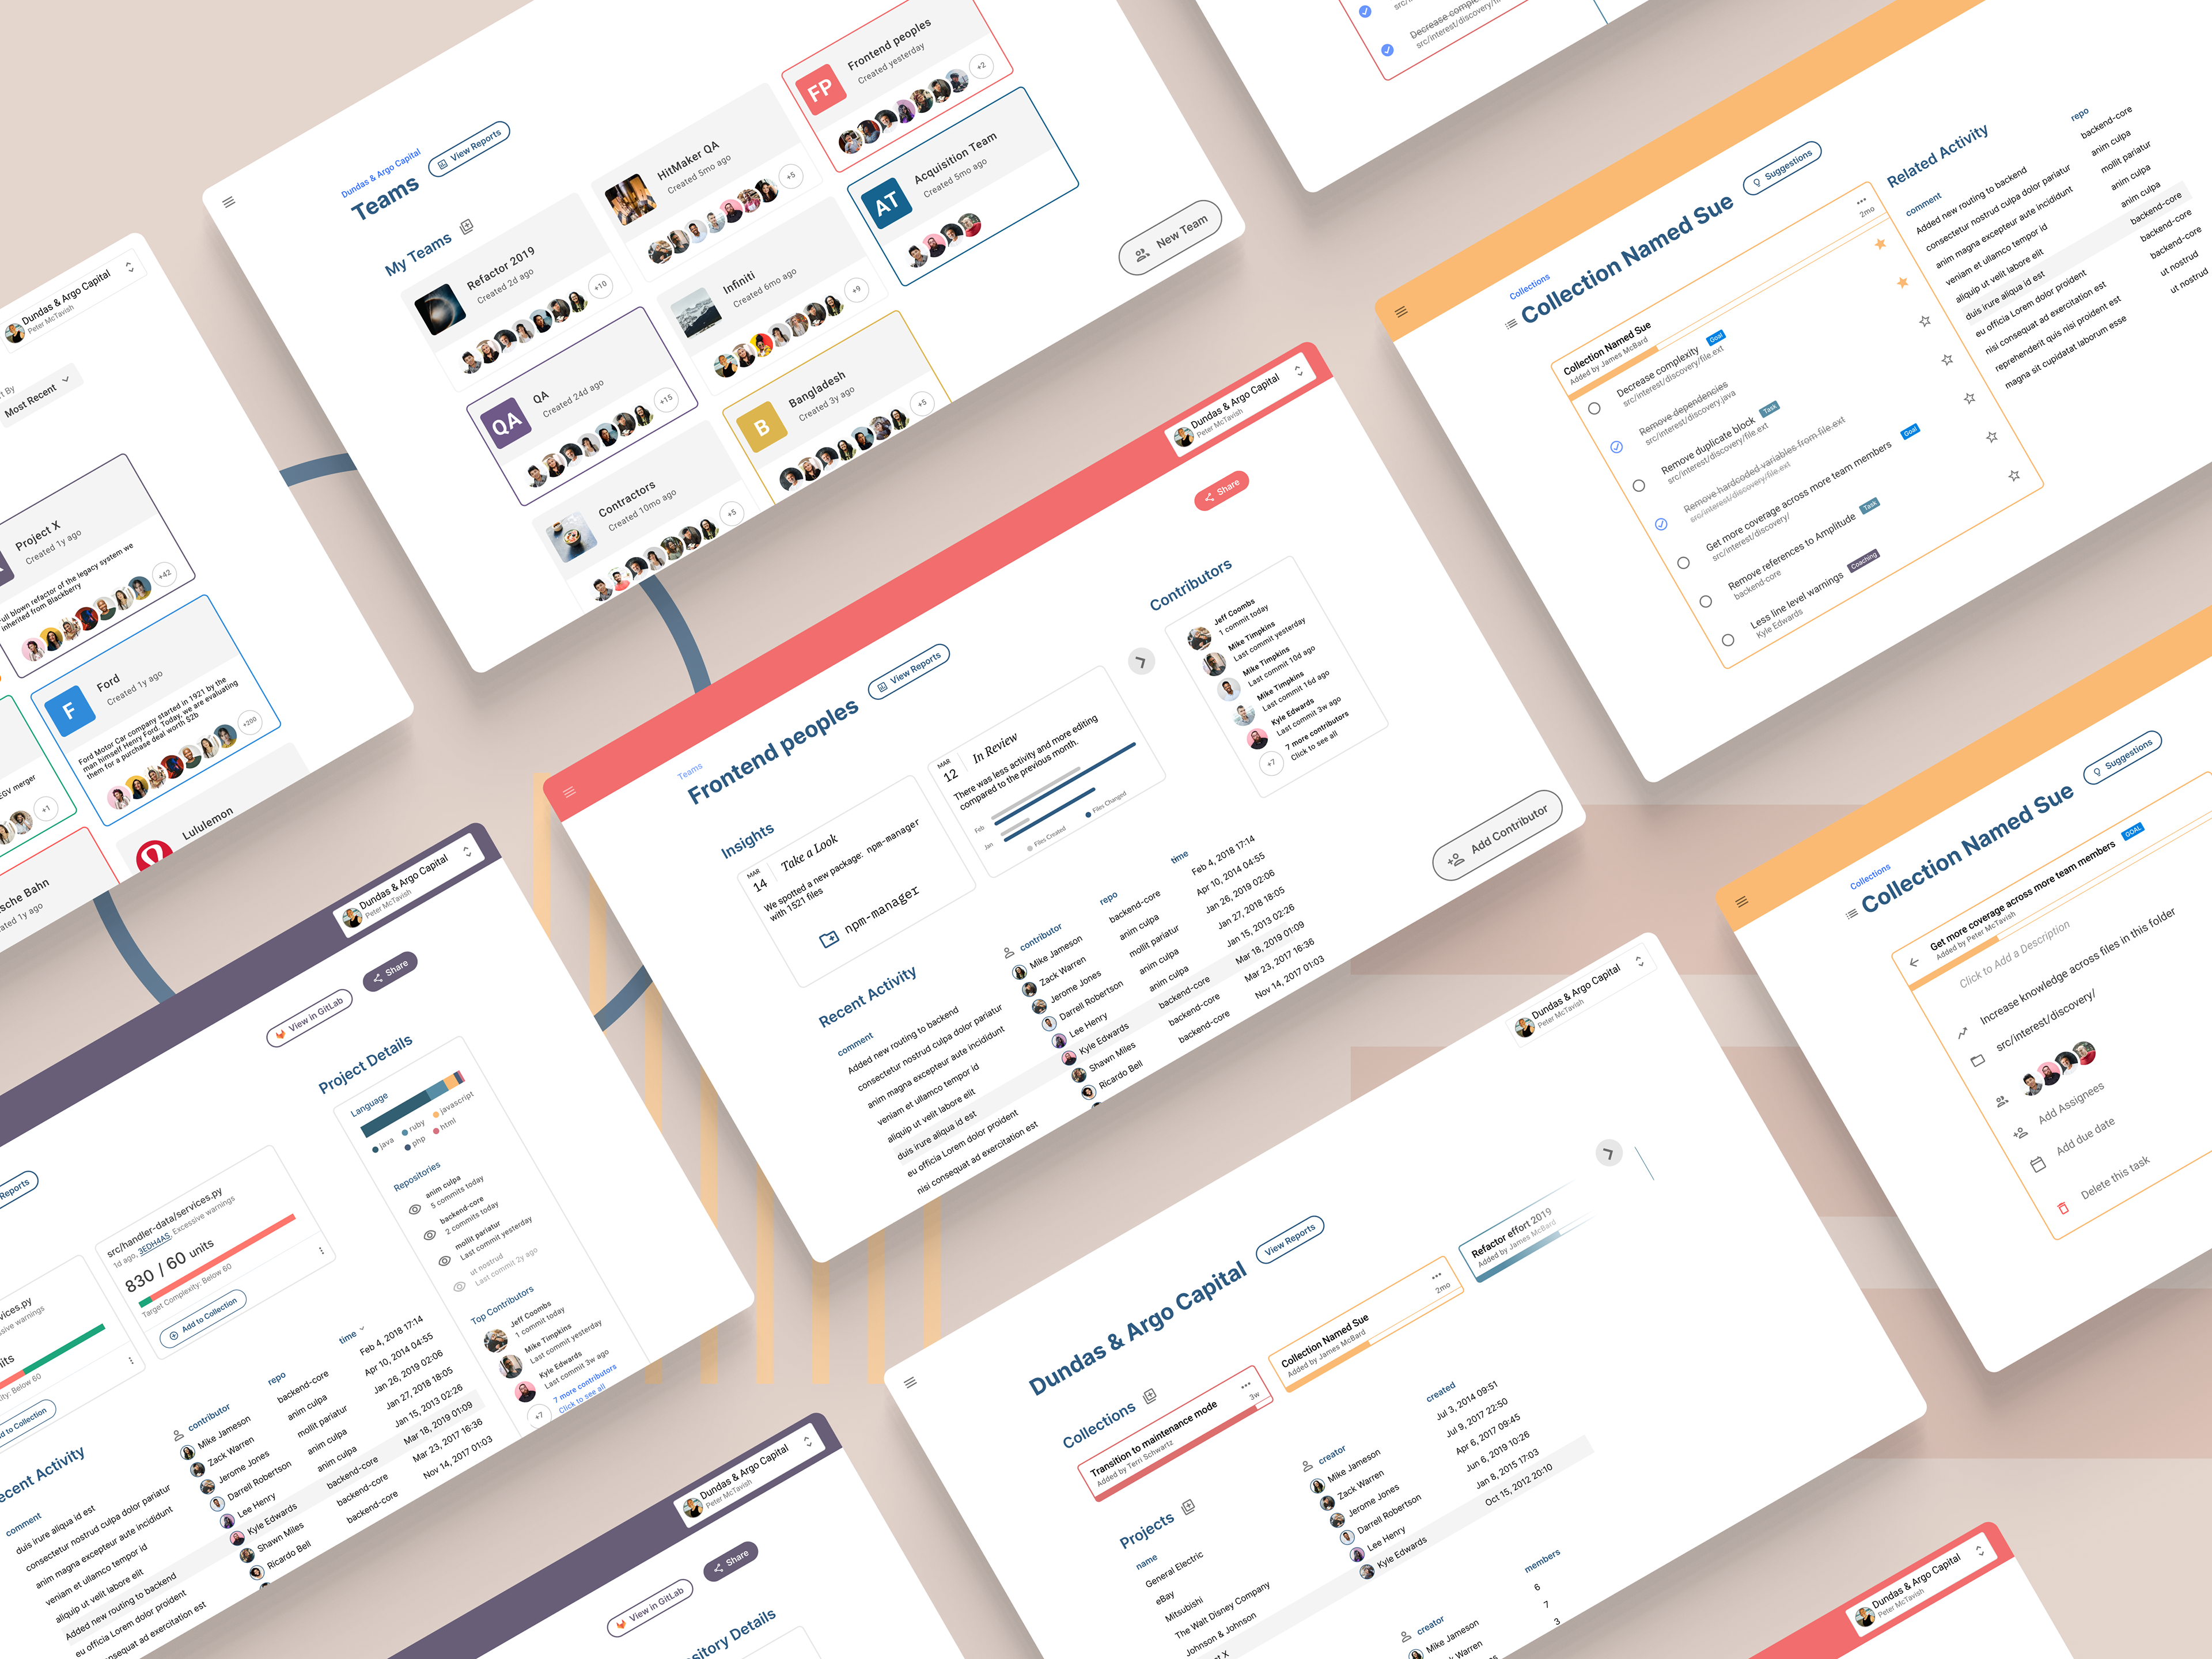
Final prototype
My last piece of work before departing from Sema was this prototype the product I believed would get people excited and engaged with our offering.
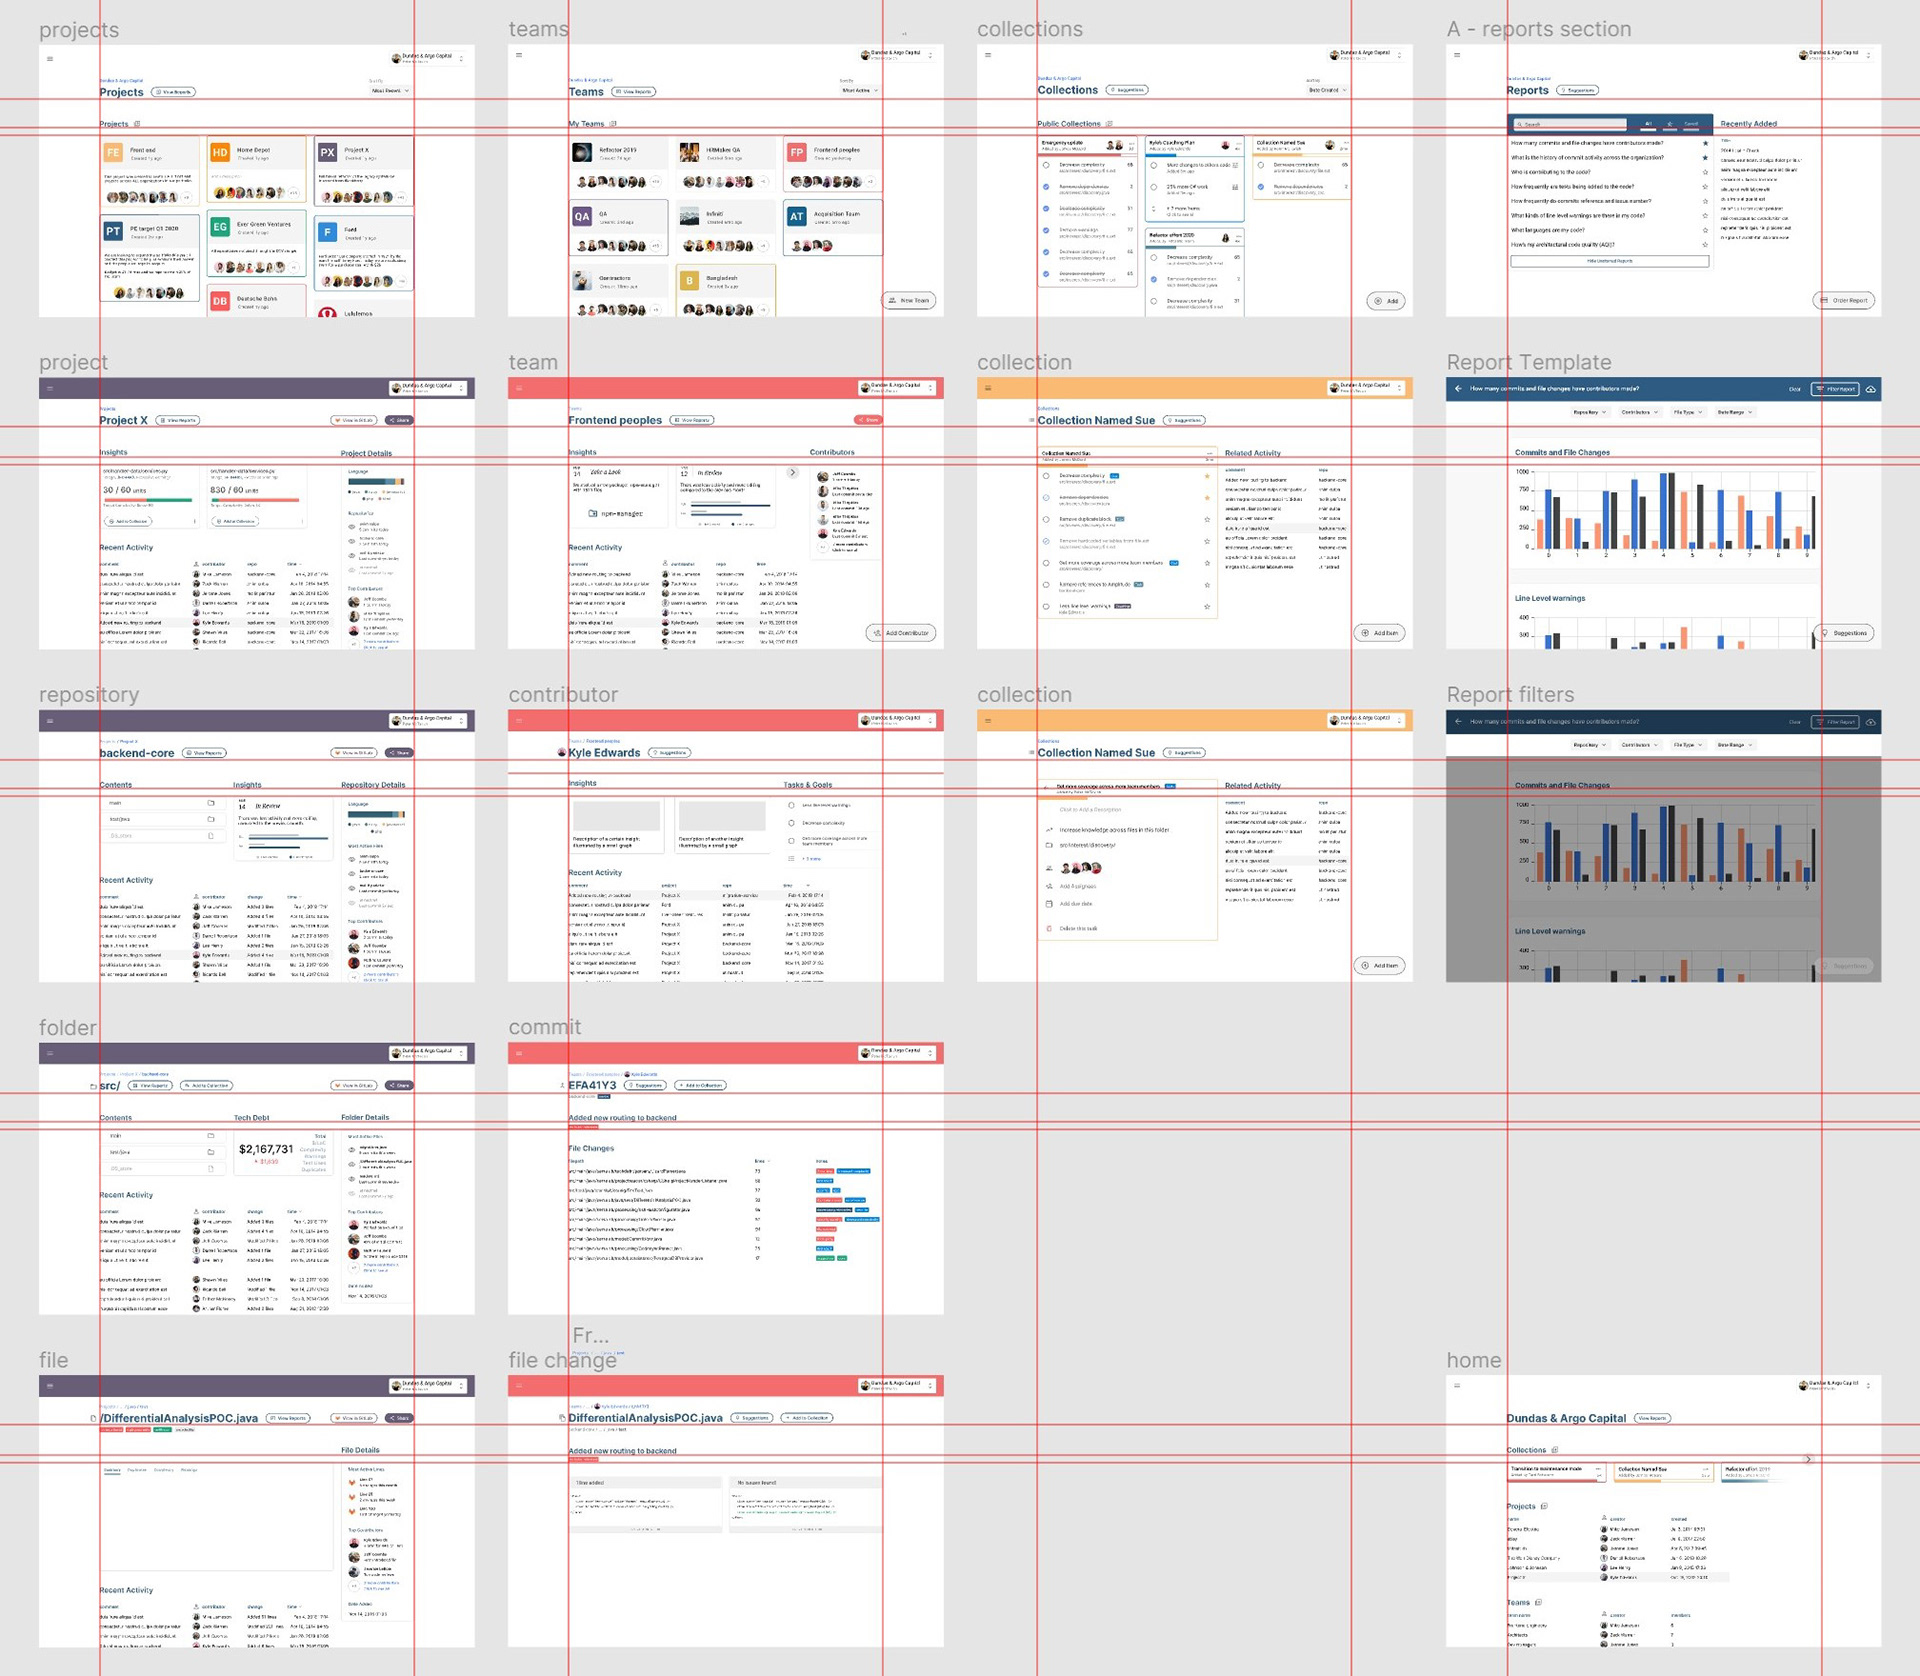
Striving for consistent layouts and patterns for an extensible front-end
I built this over a weekend tying together learning and ideas we had built towards into a single experience. I reused existing UI components wherever possible to save time.
Because it builds from my experiences as both product manager and design leader, it is designed for development. It integrates the most promising research and engineering work and helps users to engage with technical debt in a way that's never been done before.
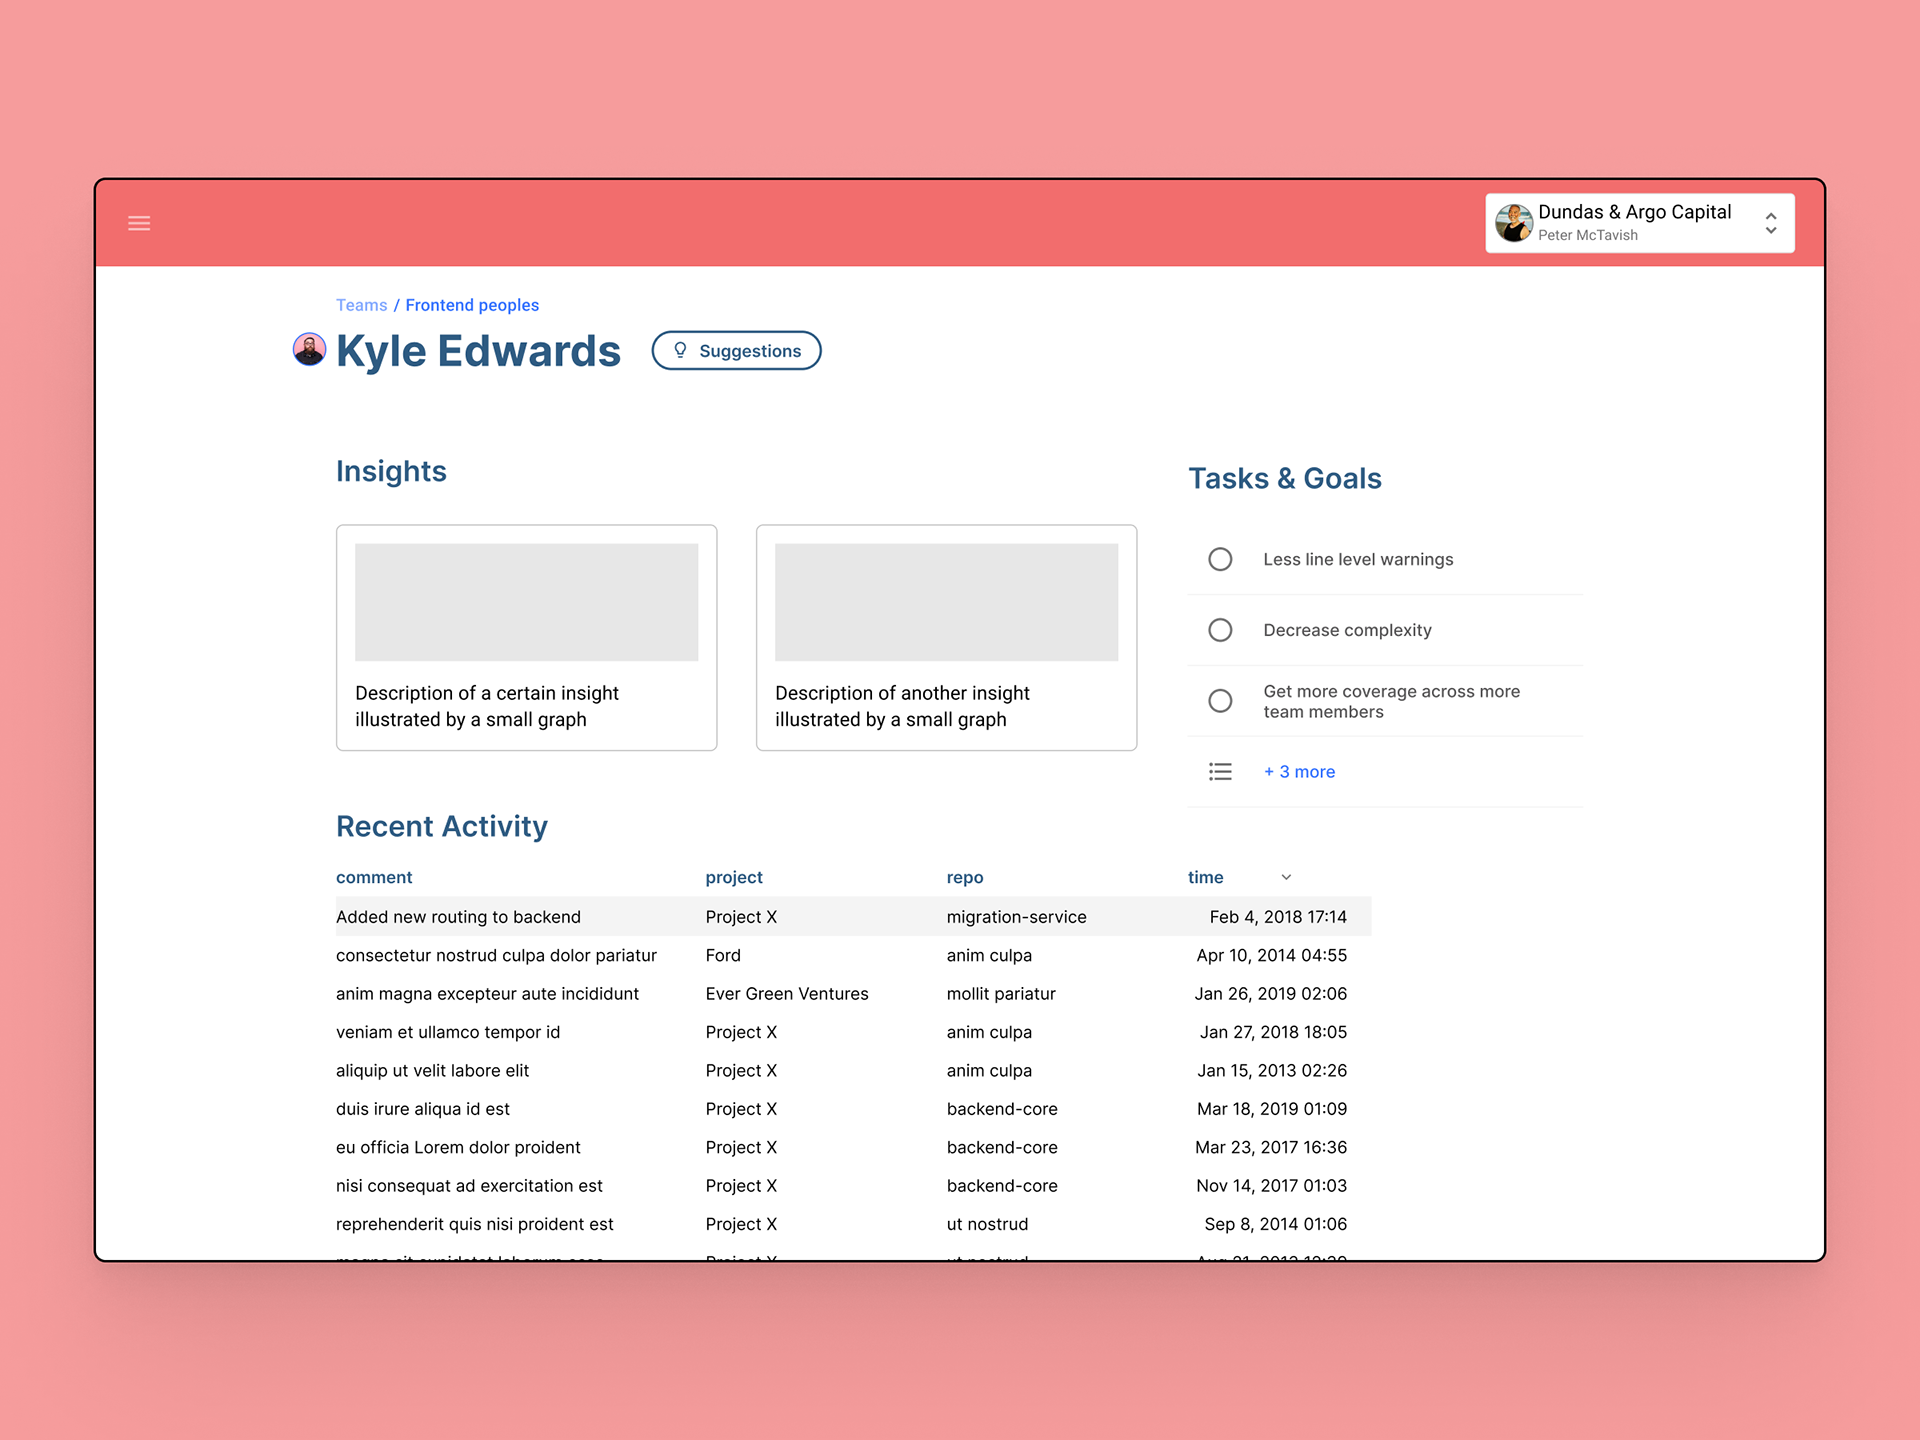
High level overview on the home screen
When a user logs in they create and navigate to Collections, Projects and Teams they're scoped to view.
Progress on Collections is the unit of work users strive to move forward, and the at-a-glance indicator of success.
From here users View Reports in the highest level context, comparing teams, projects and org-wide activity.
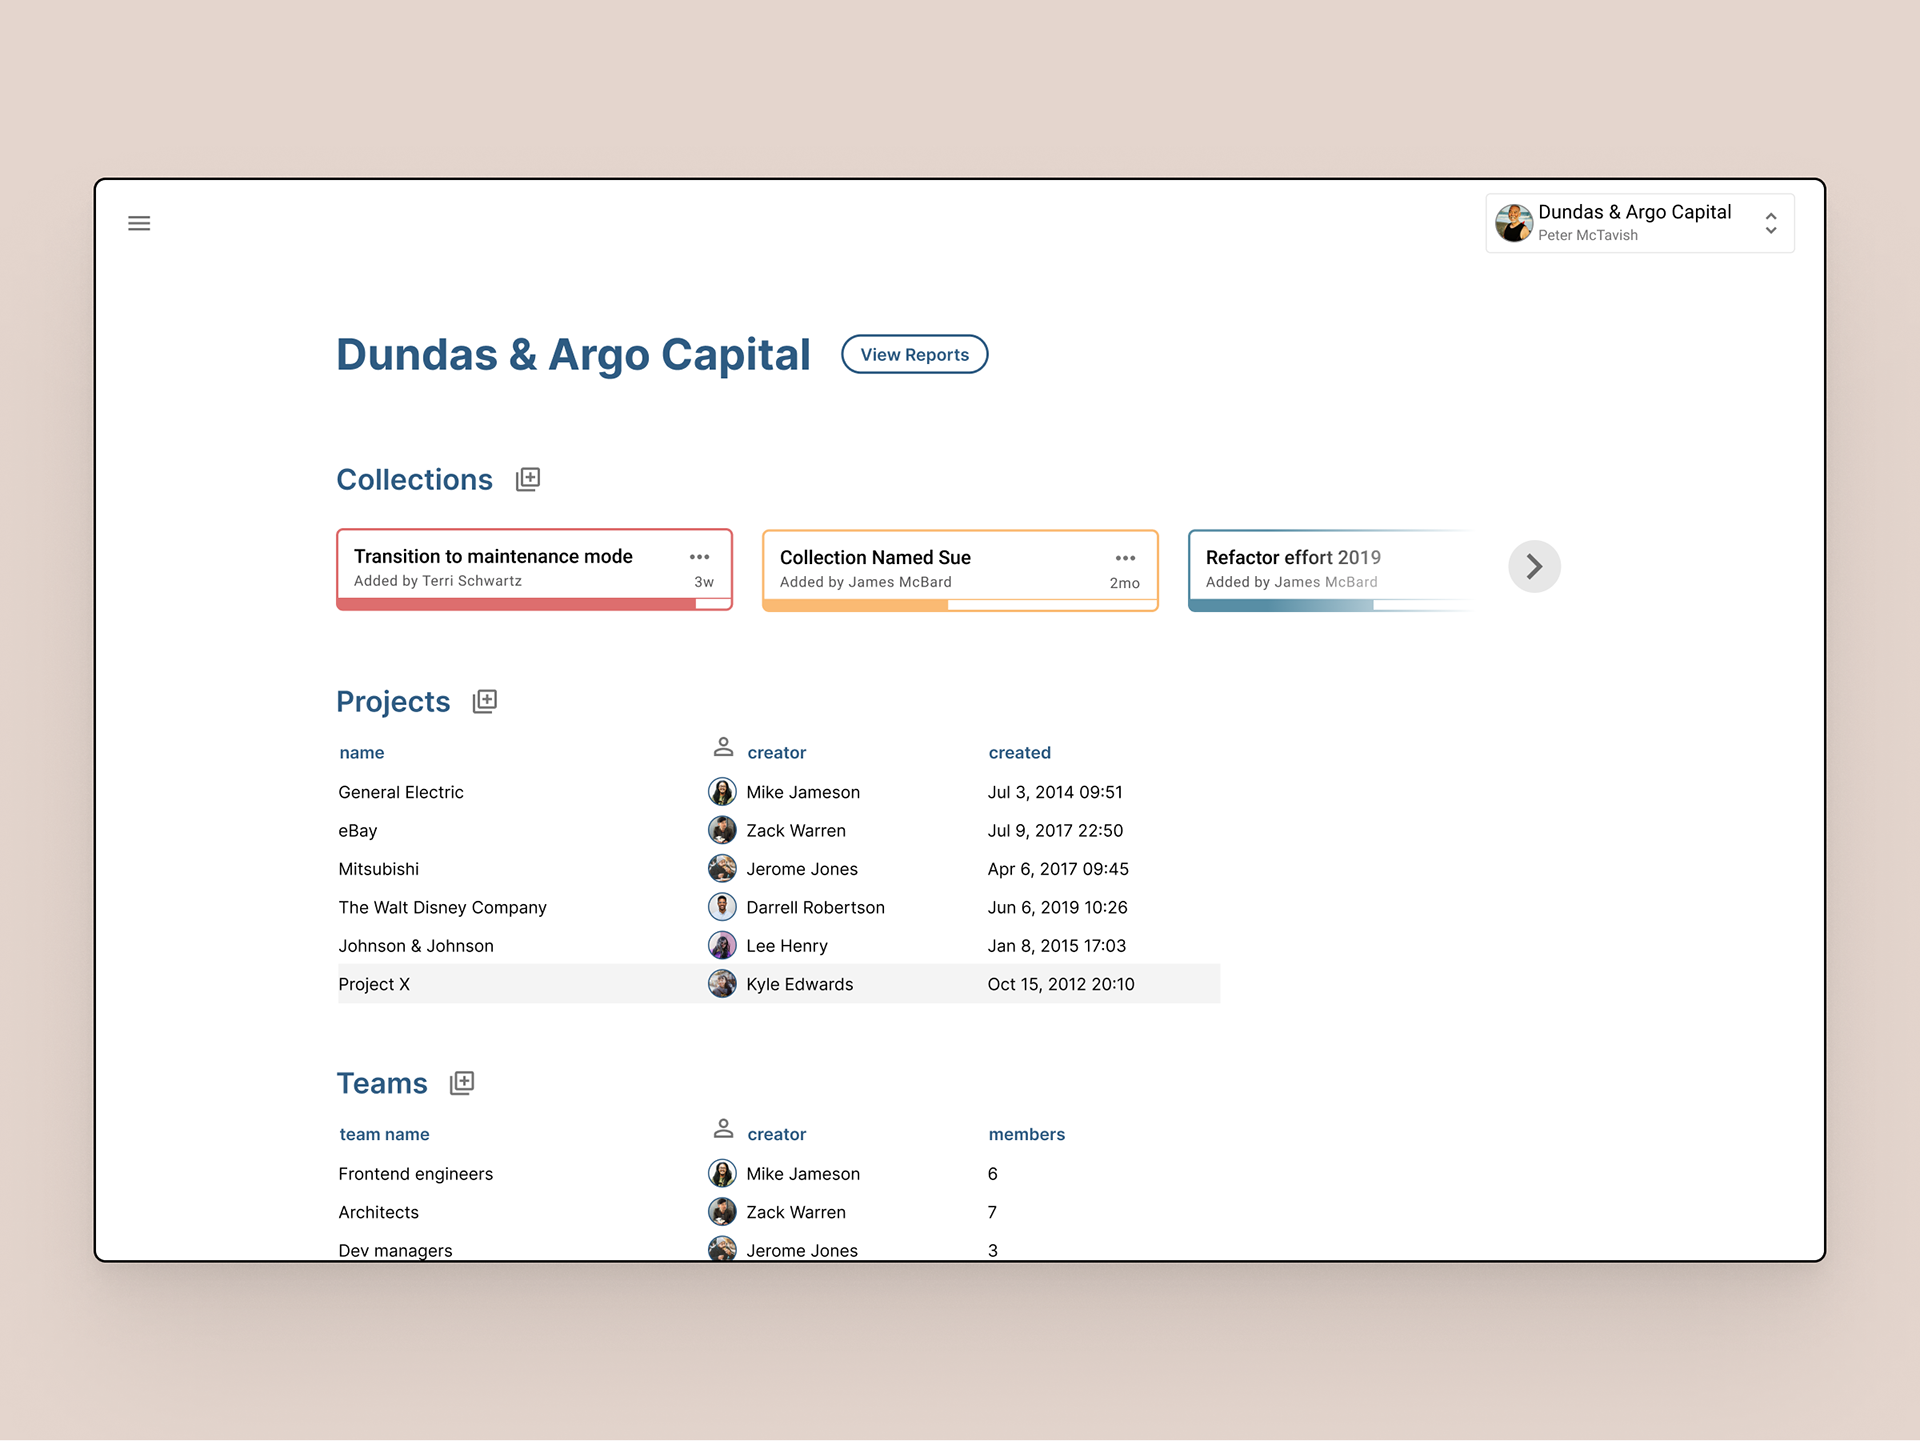
The home screen should feel light, not overwhelming. Here users see their owned or assigned collections, projects and teams.
Build measurable units of work using Collections
This is where users connect objectives to data in actionable lists. Items are suggested or added manually, and progress is automatically tracked in the back-end whenever possible.
Collections could be used for planning, coaching, or taking note of items to look further into. By default they would be private, but can be shared with other users.
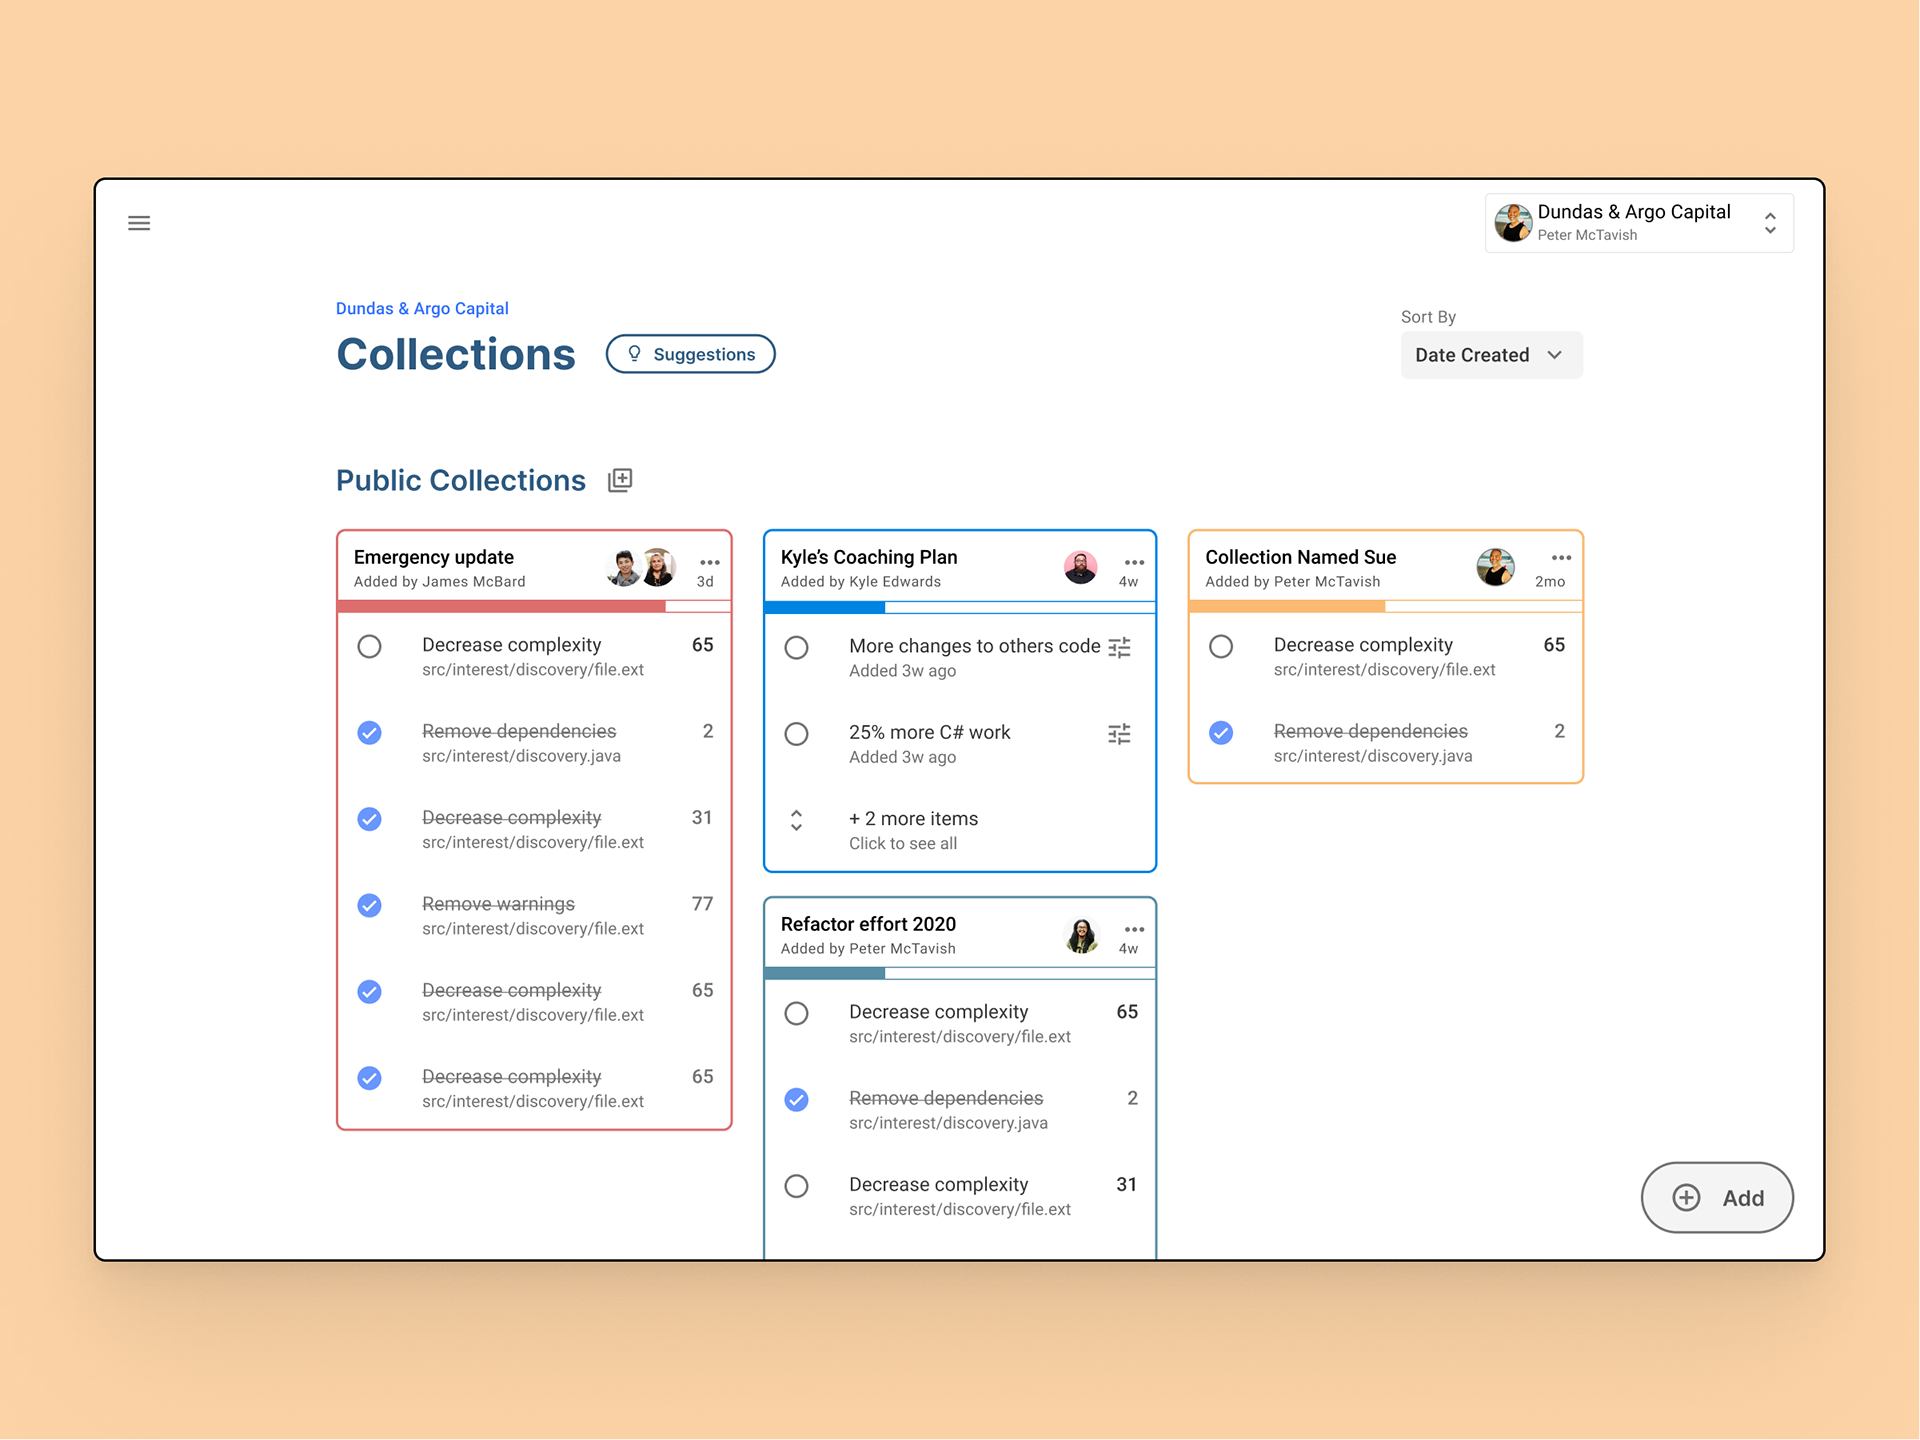
Collections overview tracks actionable items and objectives
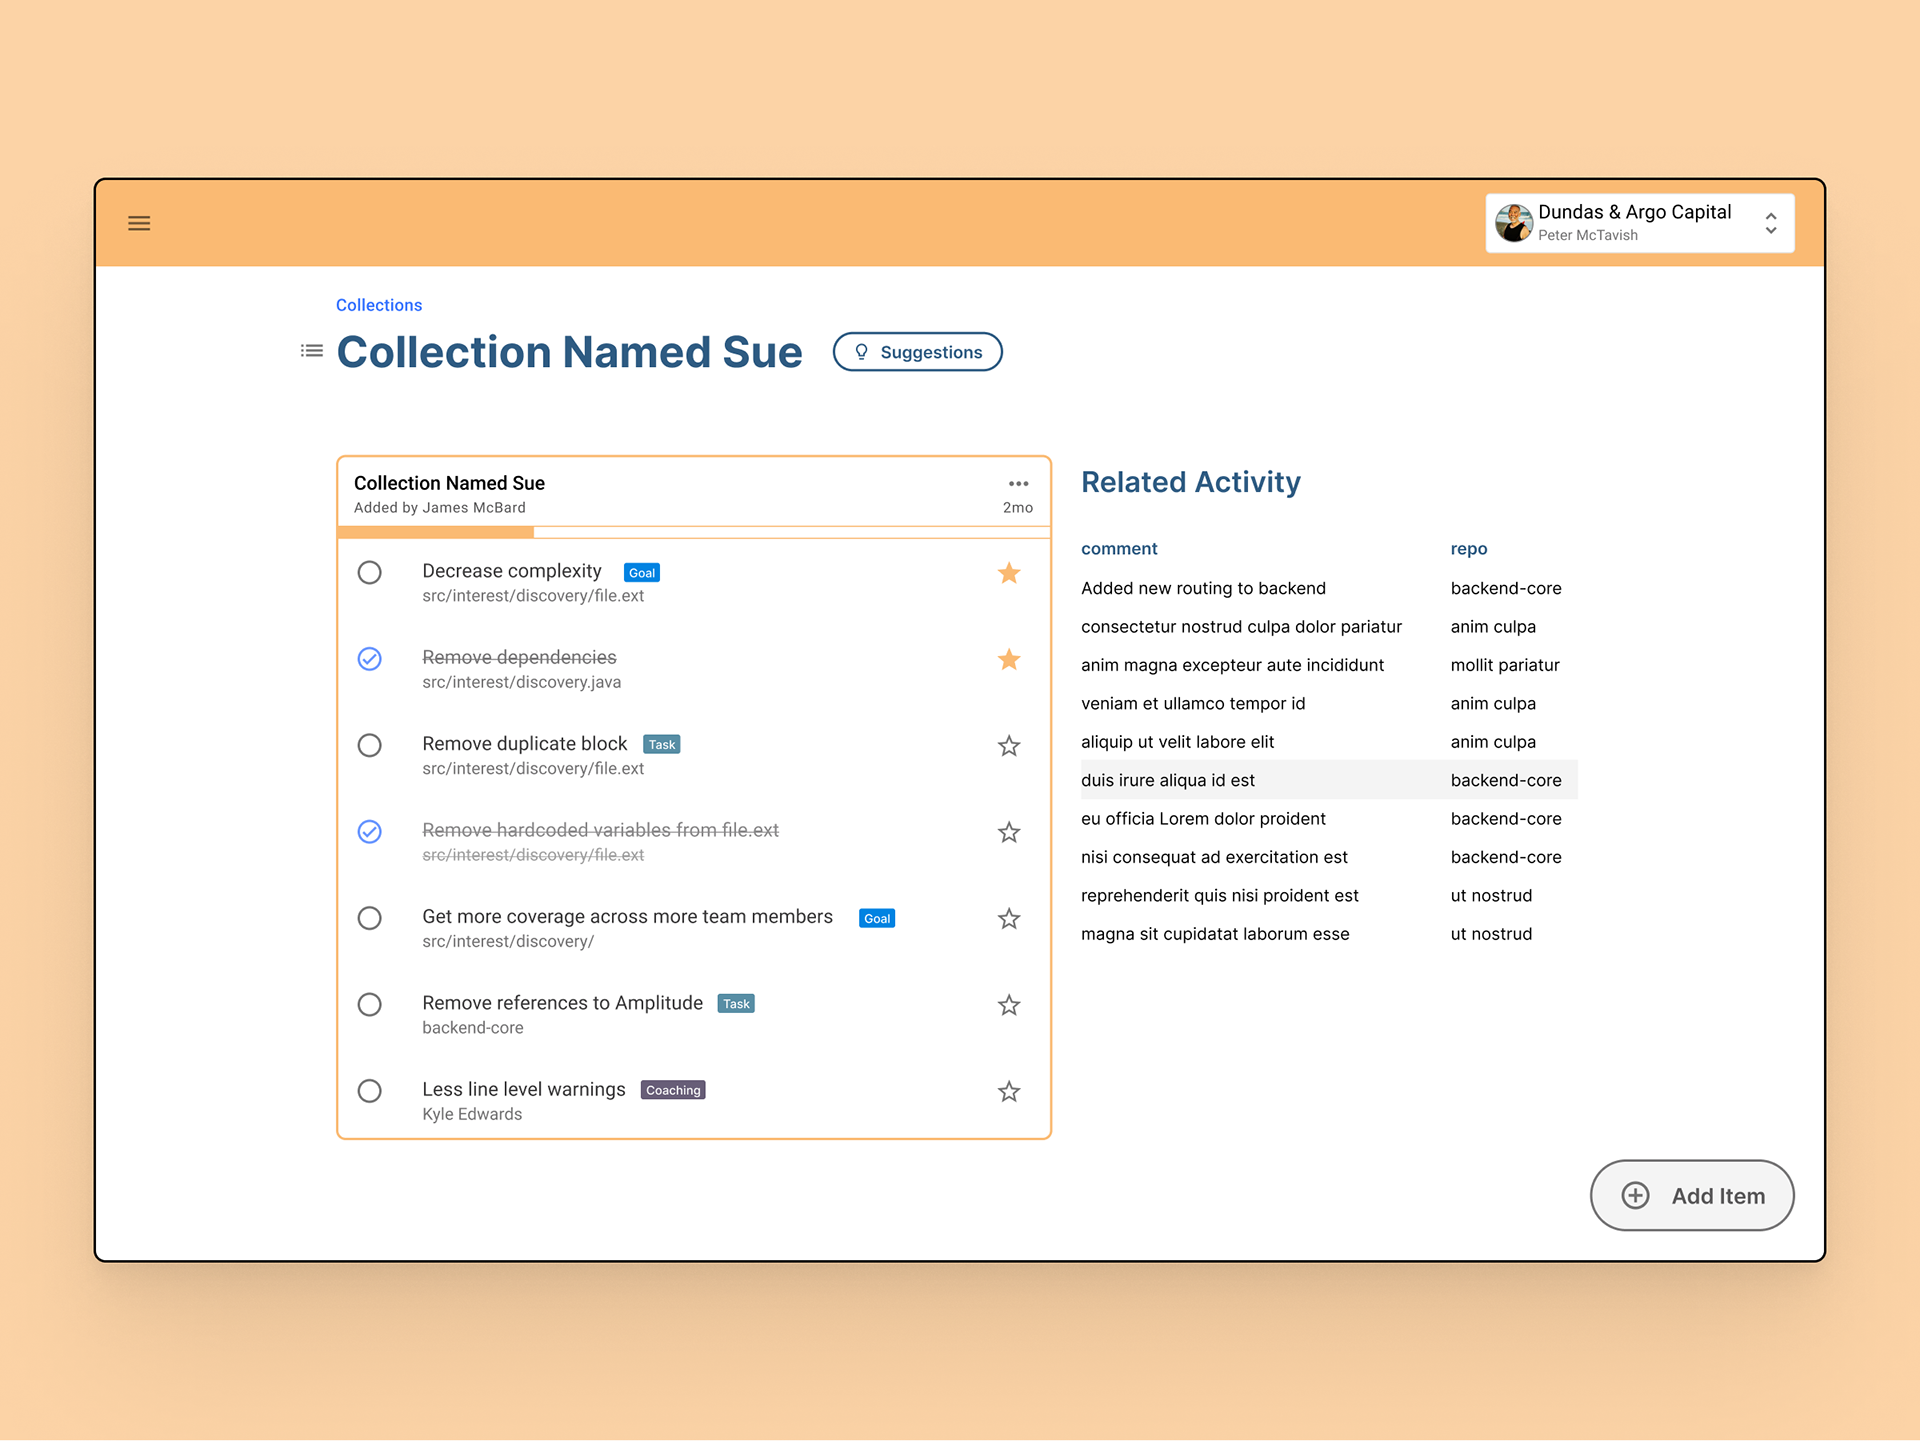
Single collection detailed view displays all recent development activity related to collection items
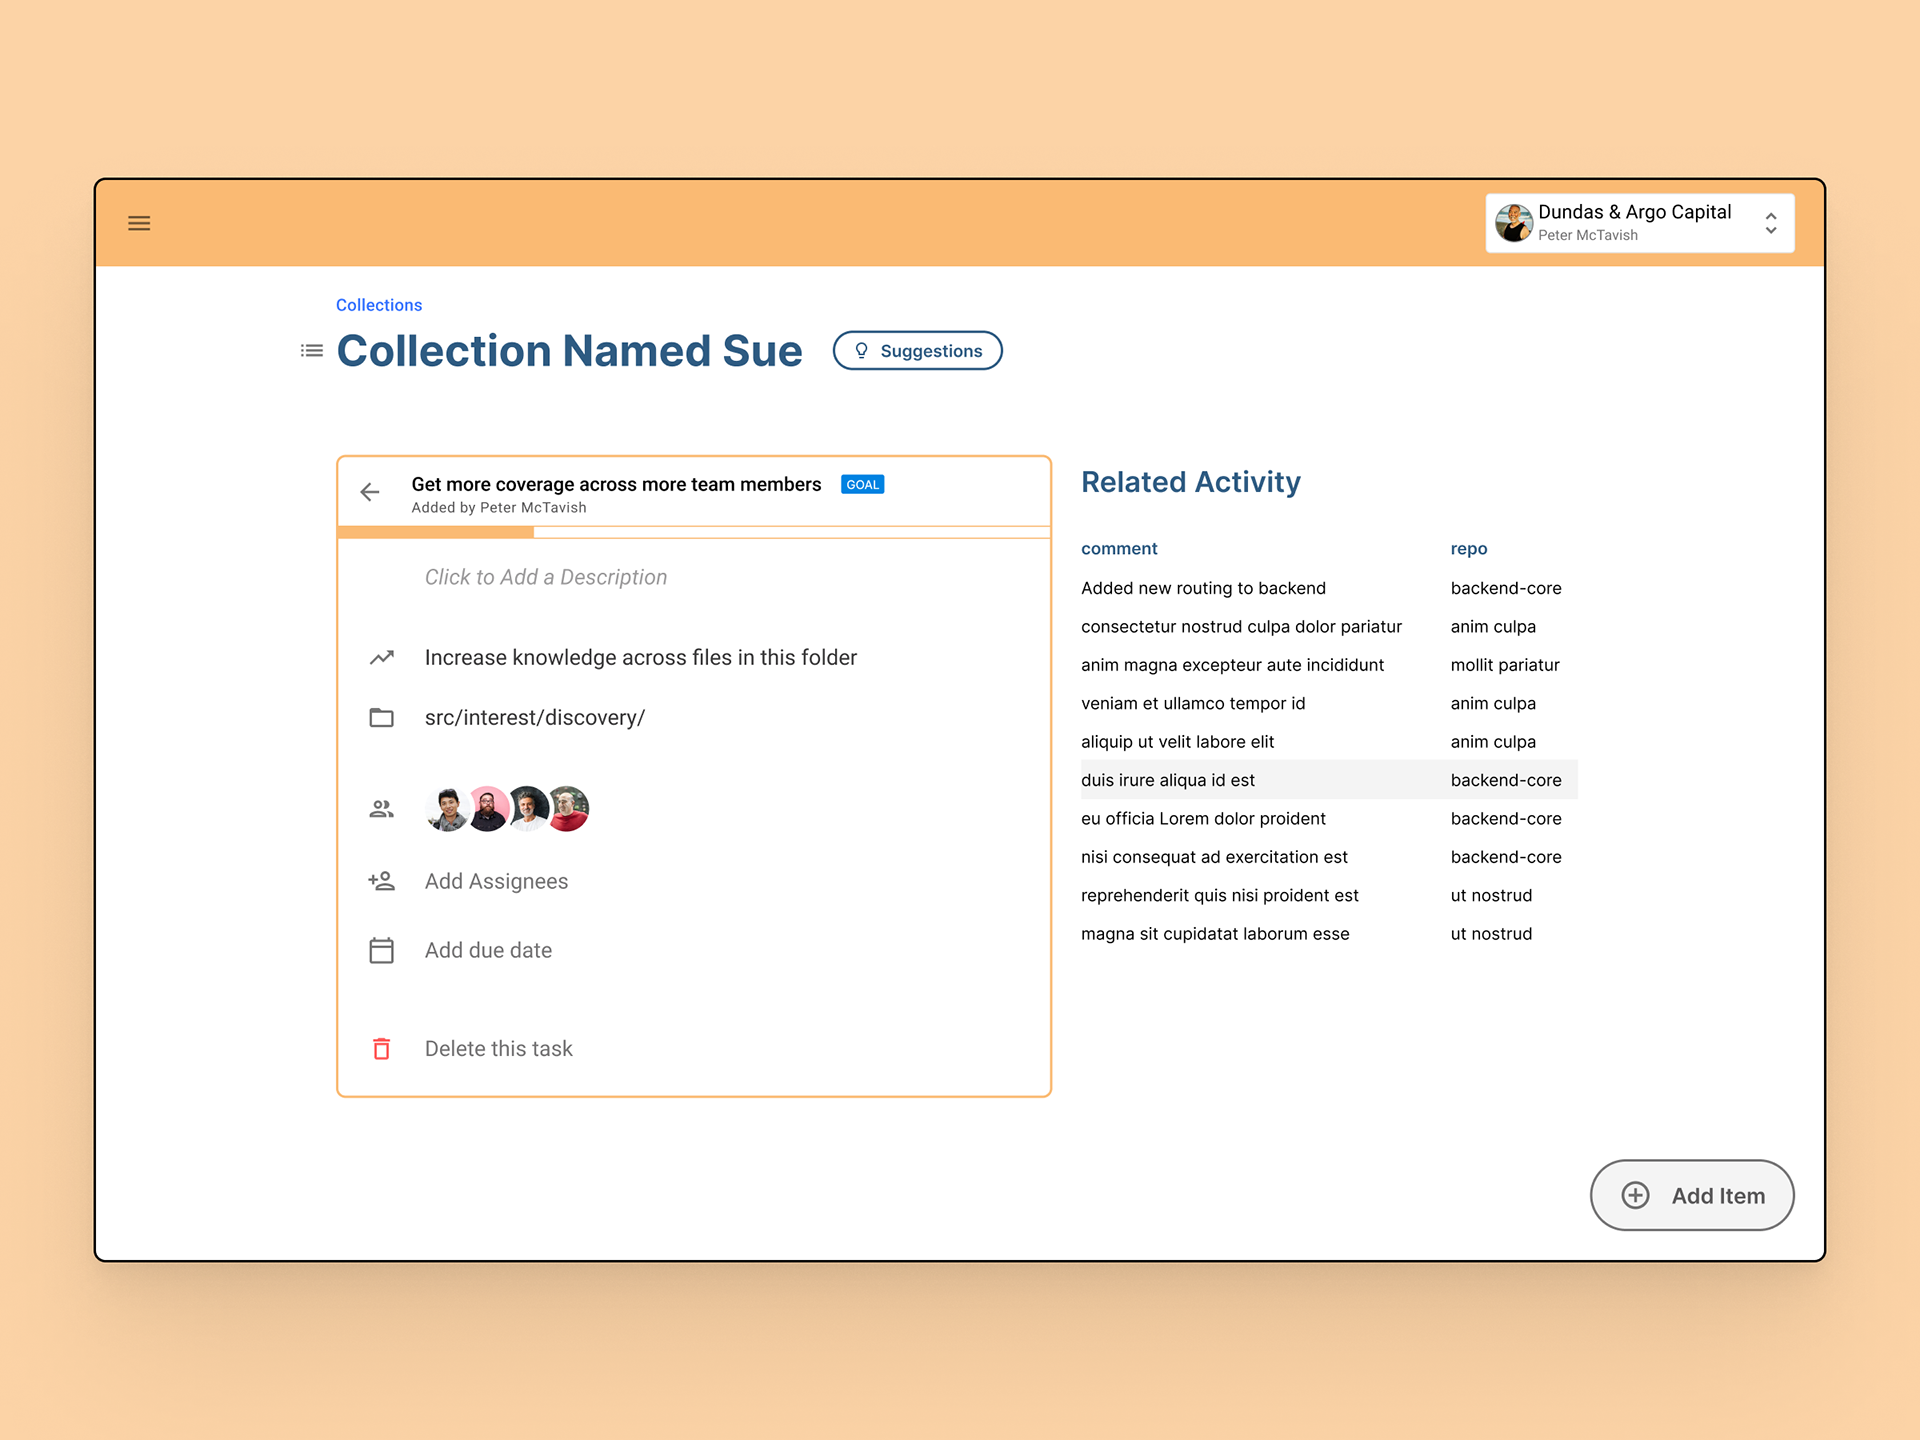
Item detail menu where the type of objective, related file or folder, assignees and due dates are managed. Recent activity related to that objective is shown
Logically organize code repos as Projects
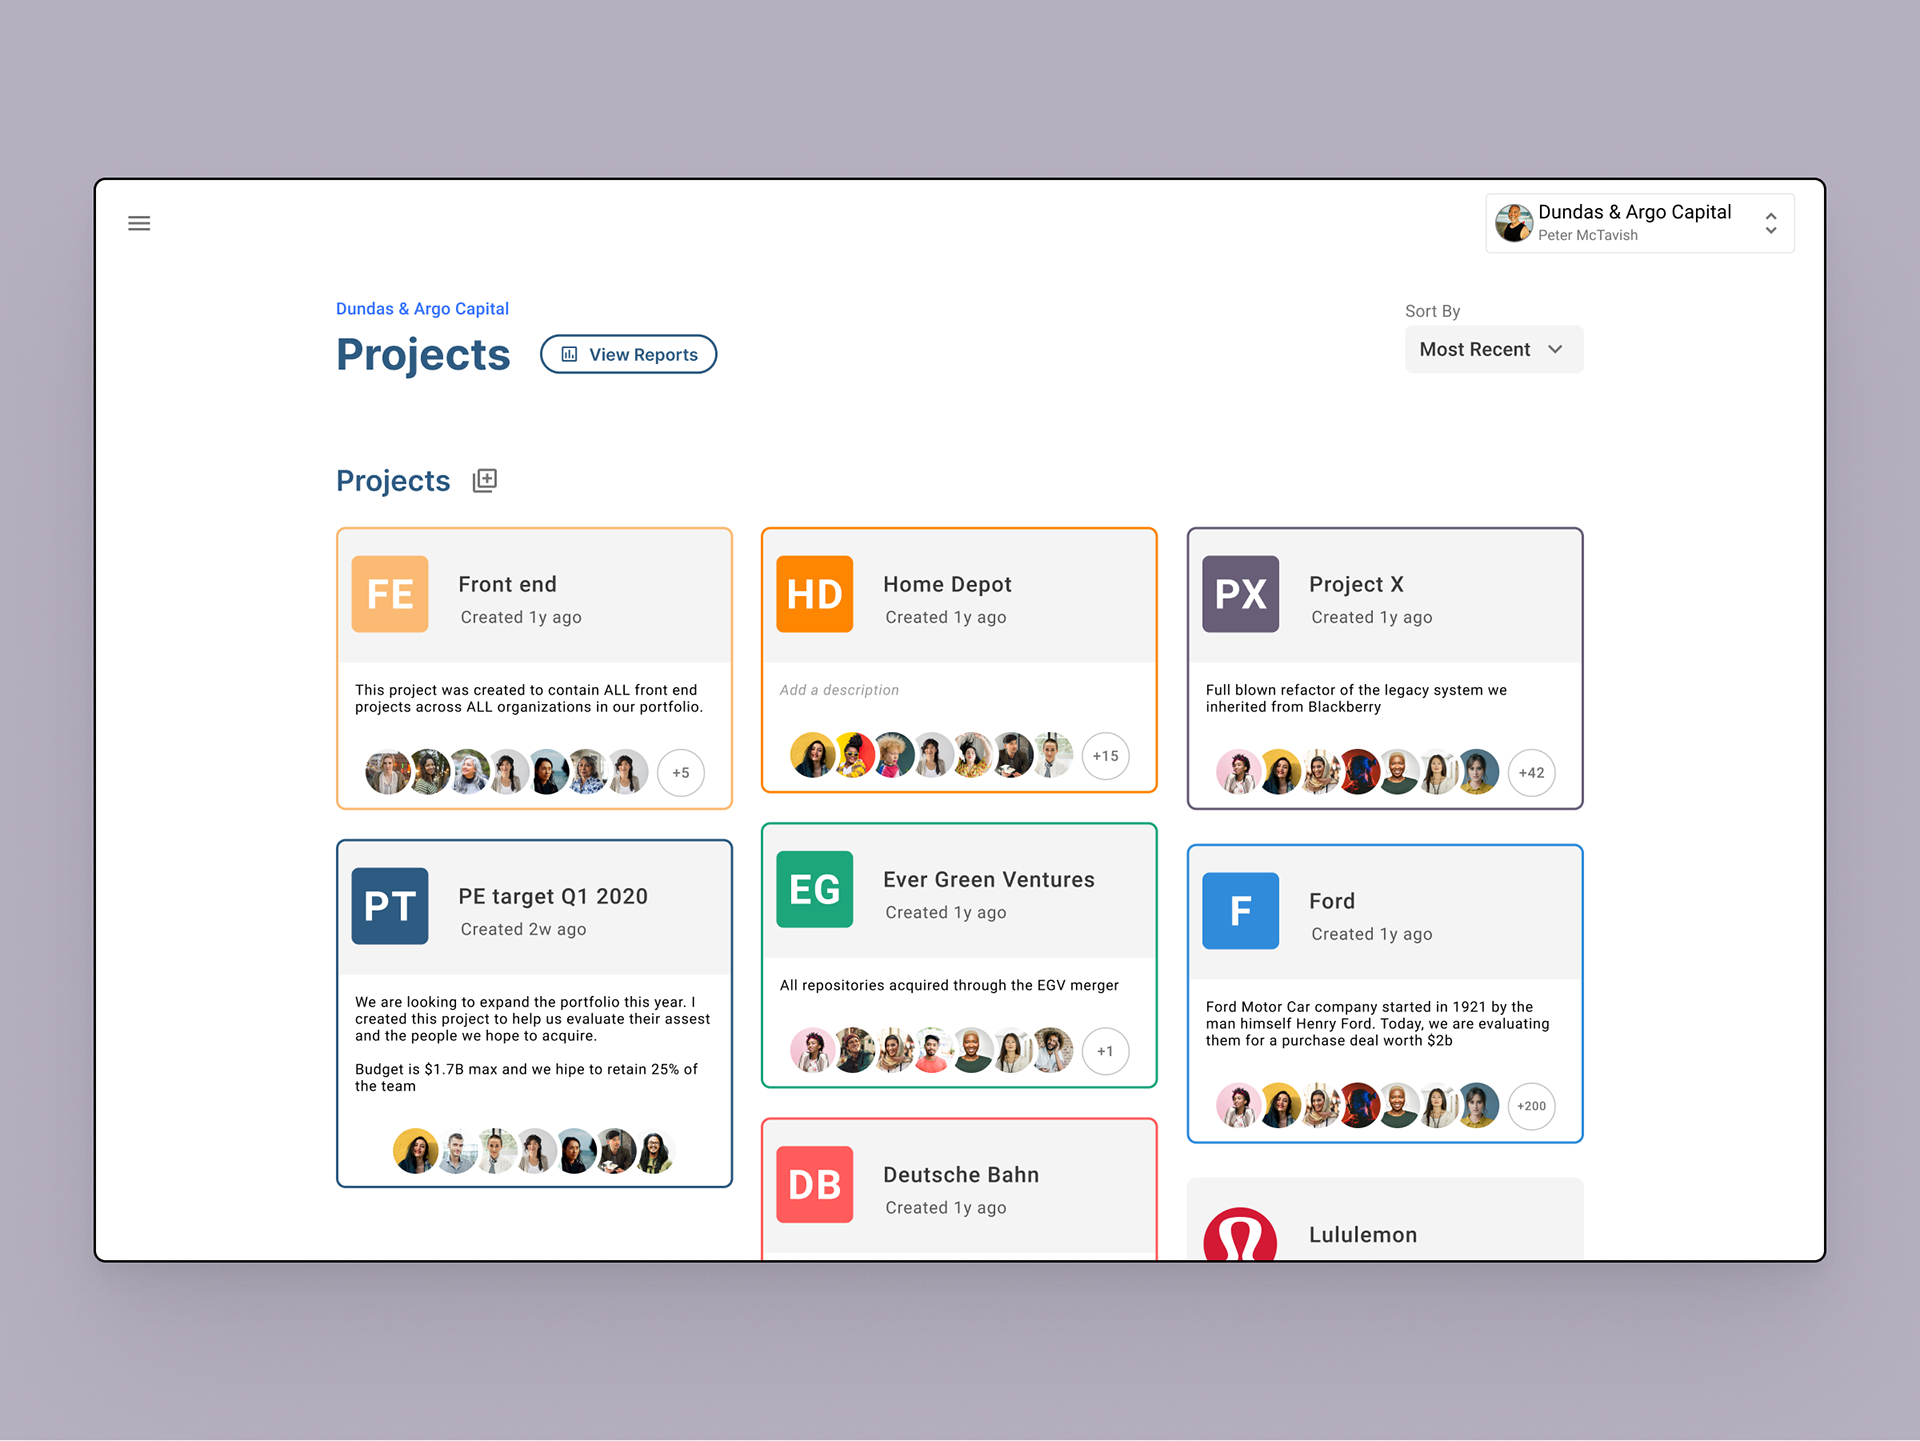
In software development what's considered a "project' often looks quite different from org to org. The Projects layer allows users to group multiple code repositories together and manage them in a way that makes sense to their process.
When a new project is created it's given a name and assigned a color. Color is used to anchor context as users drill into data within the project. Users can also add a description to help their team understand what it's about.
Collections could be used for planning, coaching, or taking note of items to look further into. By default they would be private, but can be shared with other users.
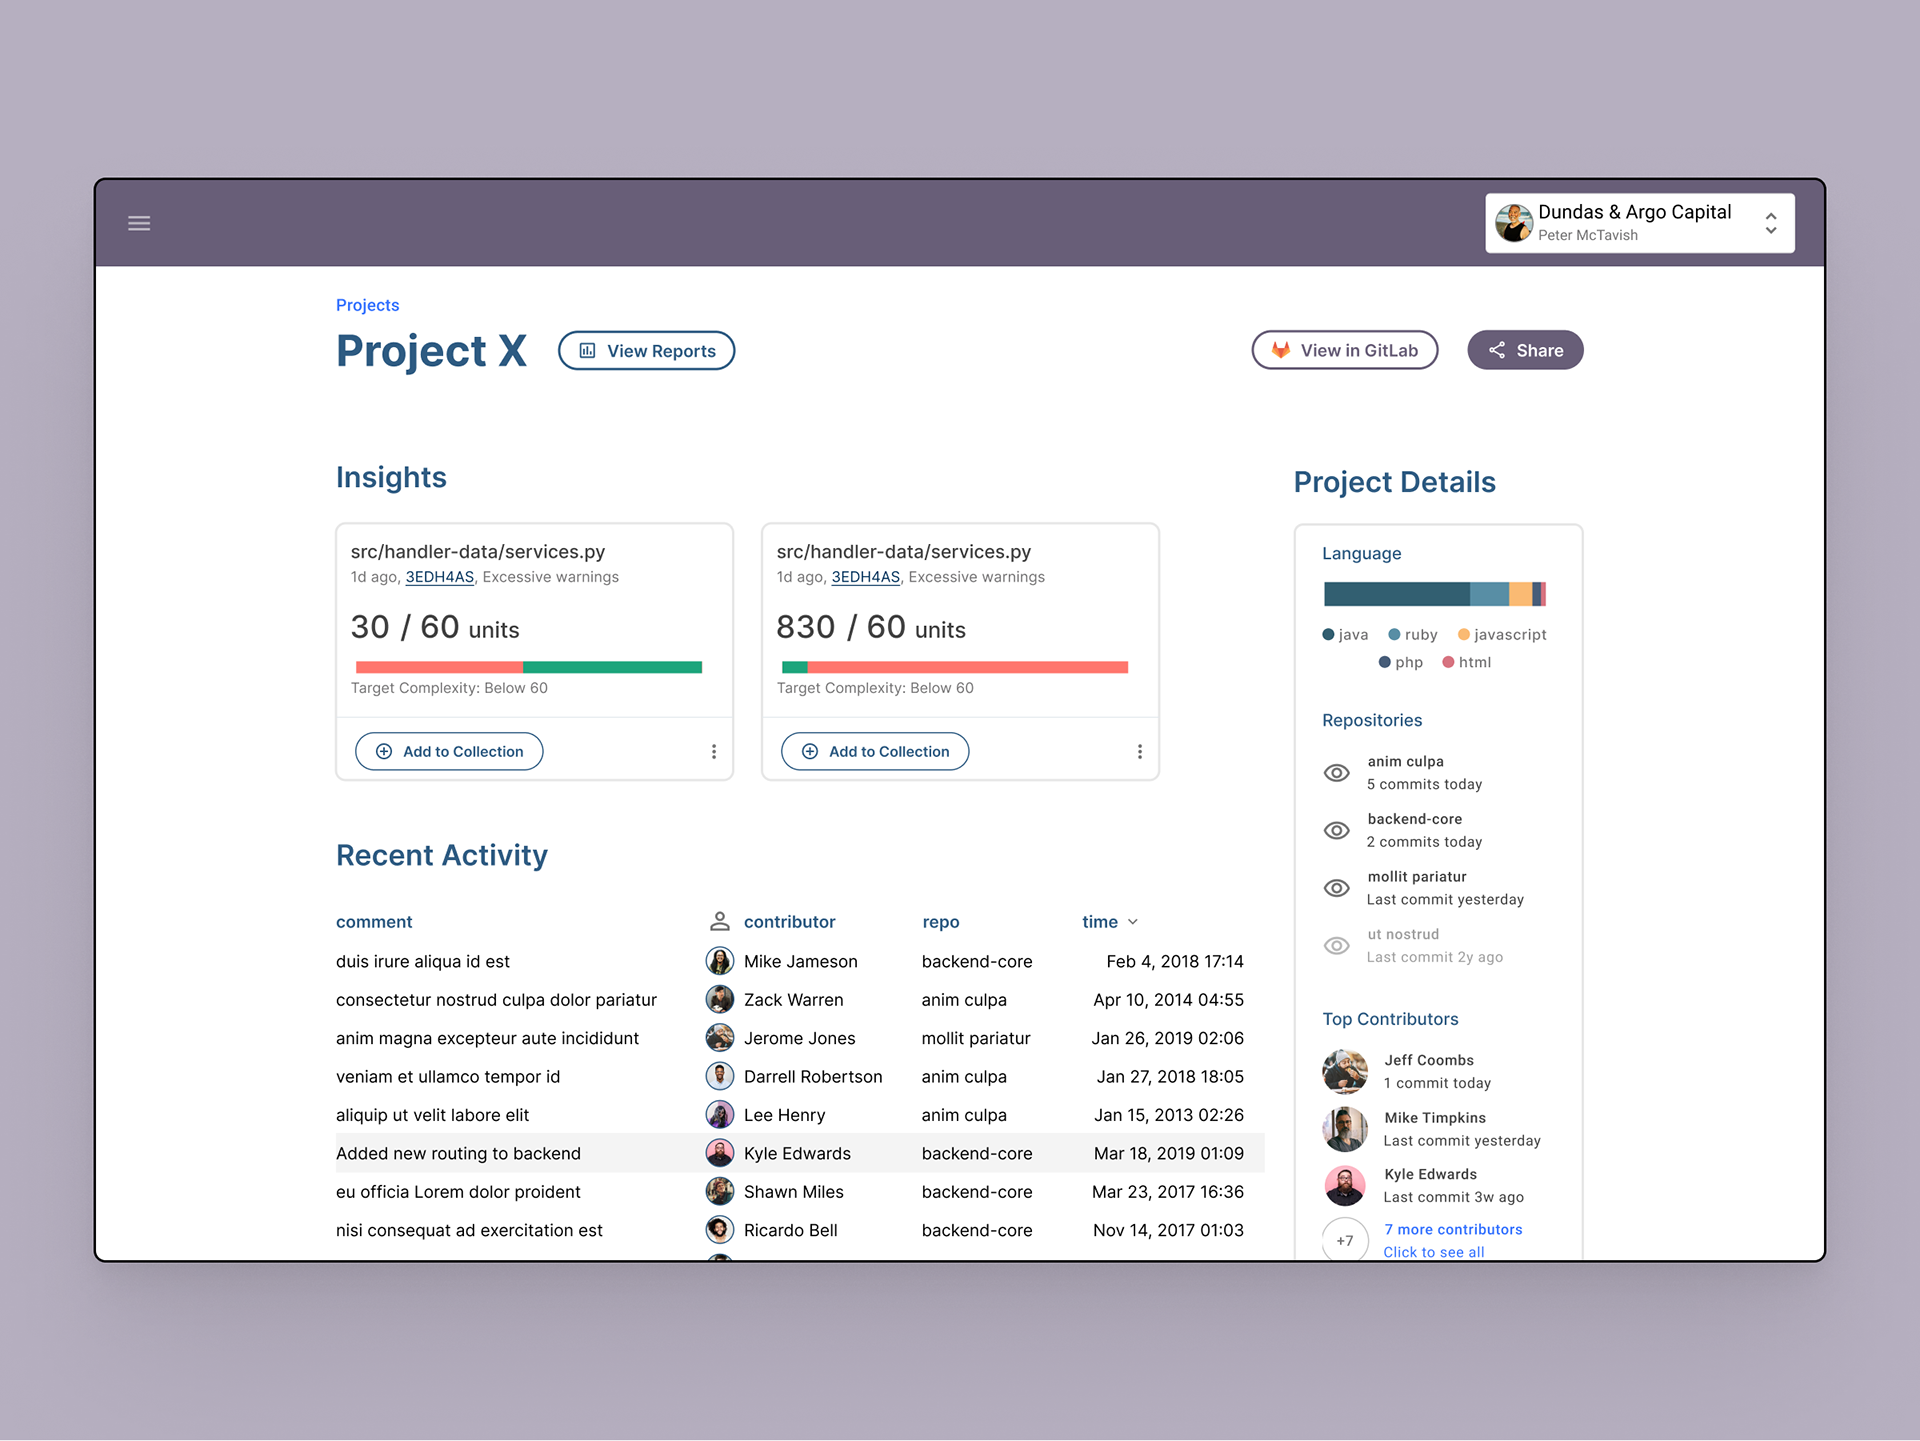
Project screen. Here we could surface insights, high-level details and activity. Accessing reports from here would filter to the repositories, contributors and files tied to that project.
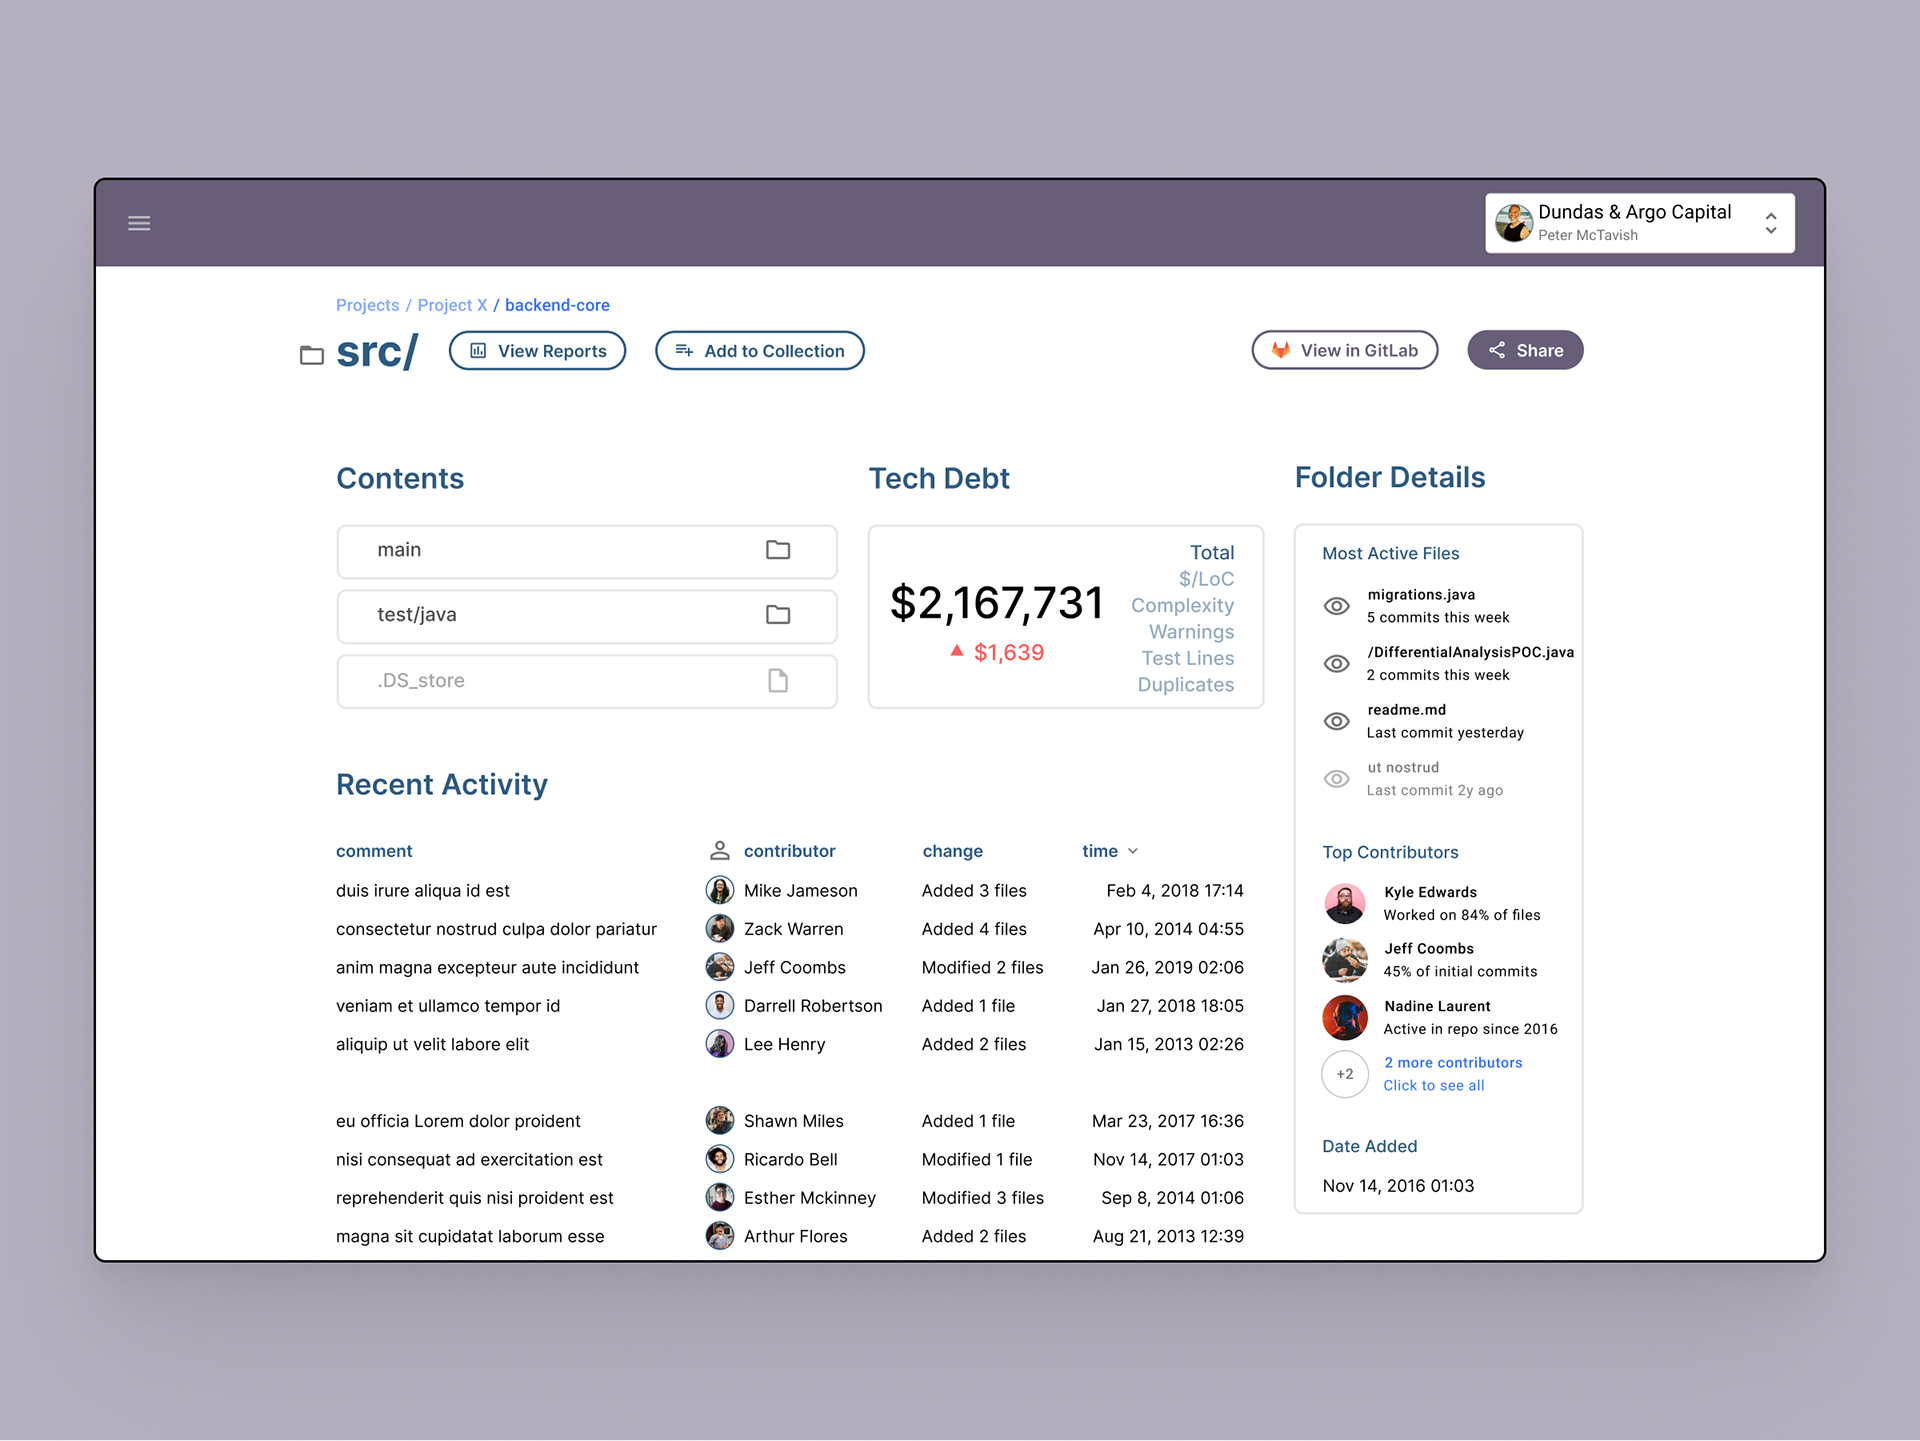
Repository screen shows details about the repo and a familiar folder structure for exploring within it. Reports from here would show analytics about that repository (that's how the product works today)
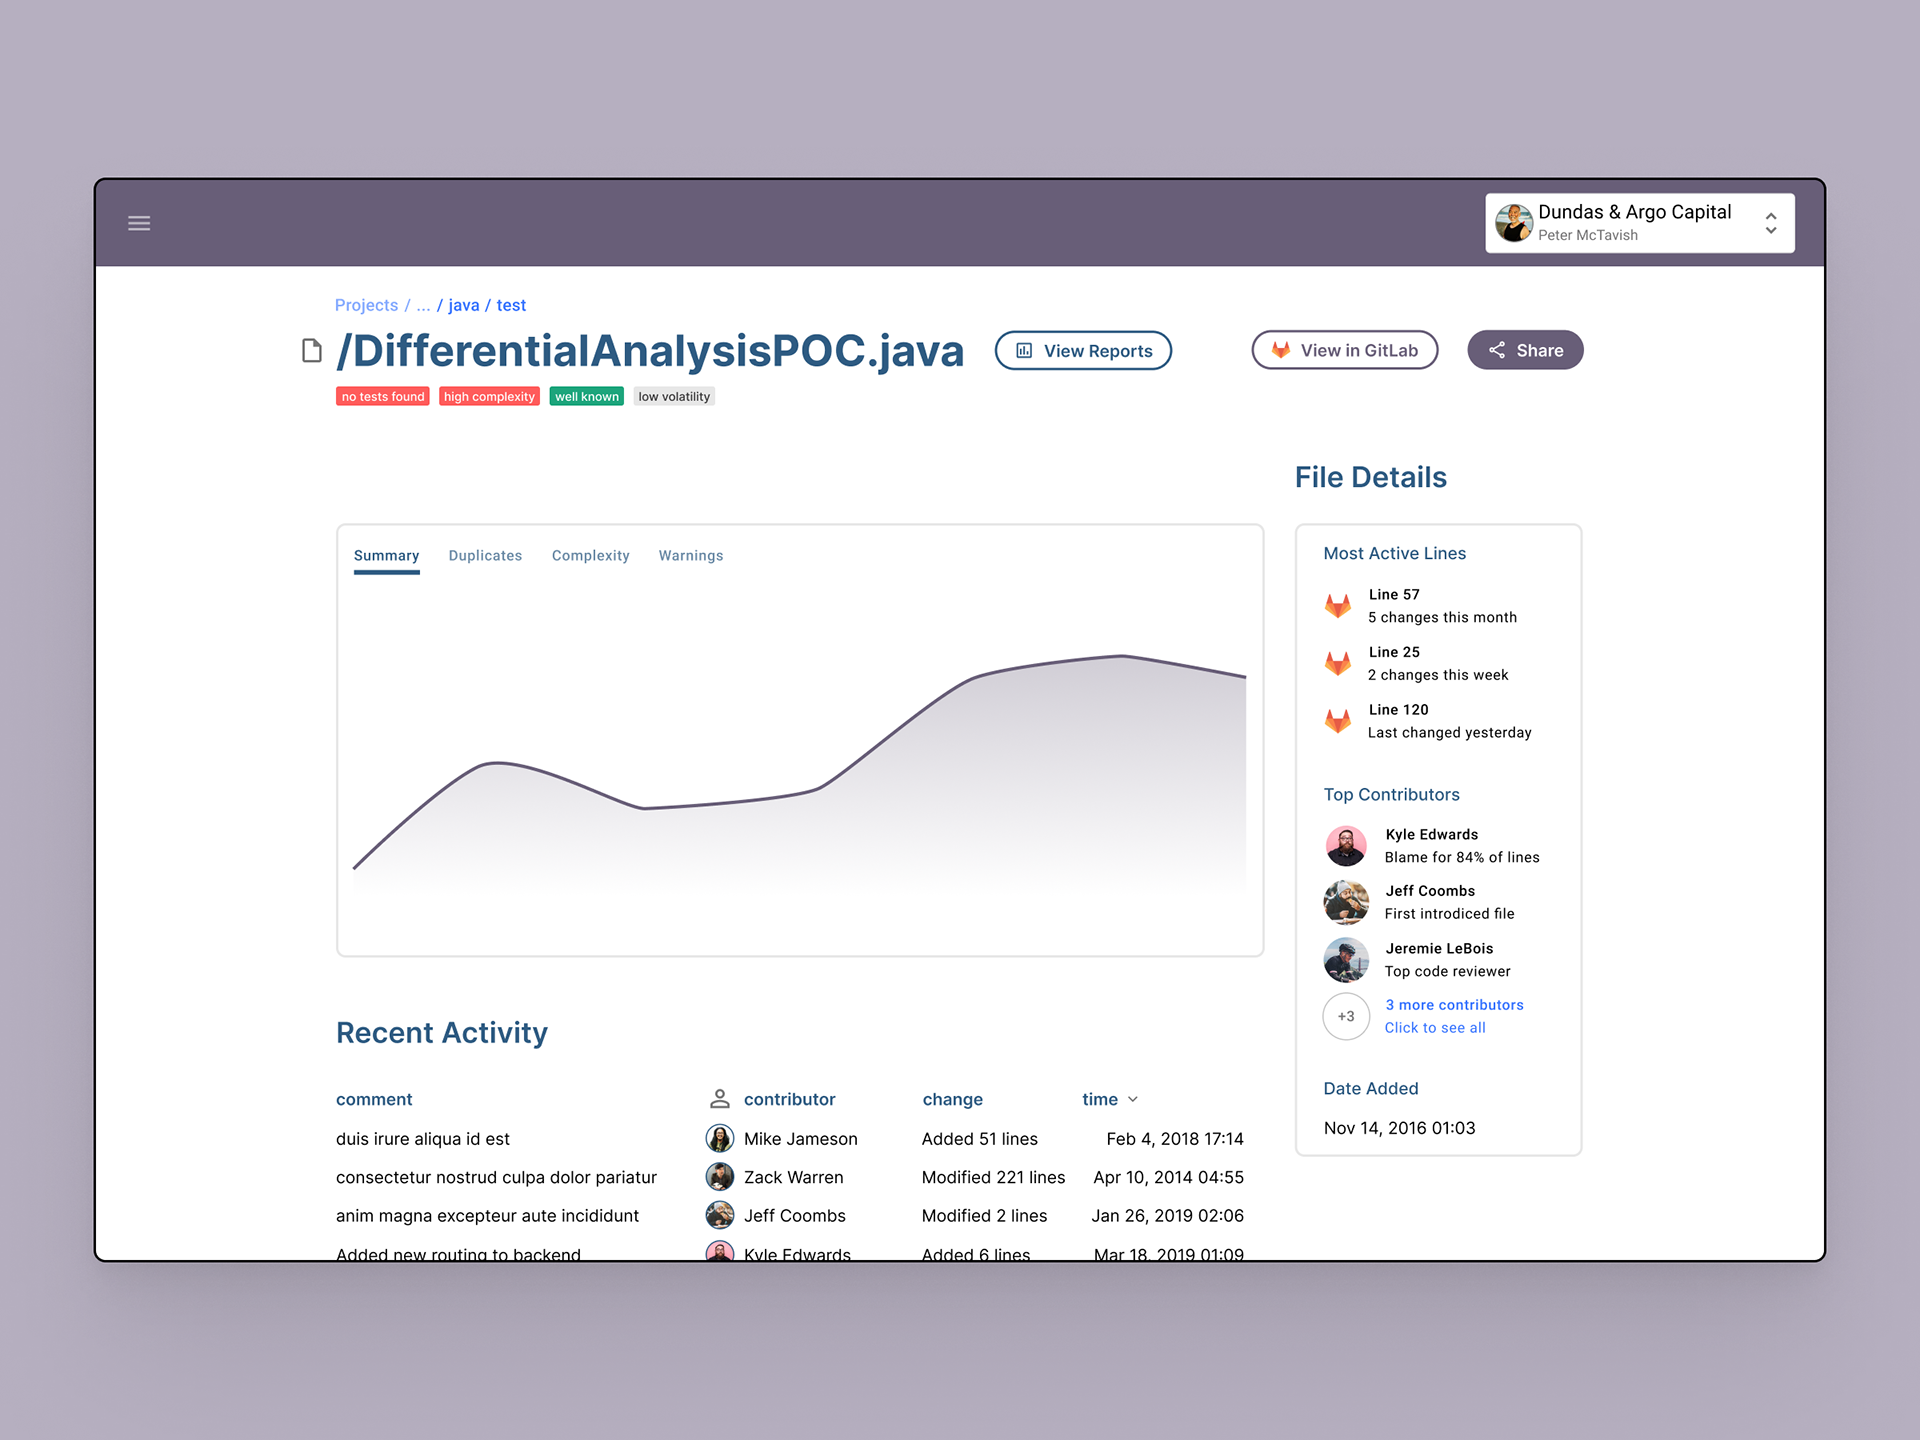
File screen shows commit details and insights on the file over time. Issues or notes could be auto-tagged or manually tagged. These examples are things Professional Services might typically point out to clients.
When users view a project, they get a high level overview of important insights, details and activities tied to it. As they drill in further to a repository or a folder within that repository, the data and insights displayed on the page adjust to that context.
In the example above, drilling into a repository or folder reveals the contents within it, allowing managers to navigate to specific files and items that are targets for improvement. They can add metrics and files to
Augment technical people management with Teams
As a manager, I might be responsible for a developer who works on multiple projects and repositories in the org, some of which I don't oversee directly.
People managers could use the platform to follow the efforts of their teams grouped in ways that weren't previously available; contractors, new hires, front-end. This was a challenge users often dealt with through internal knowledge of the team alone. With the code quality platform, that knowledge could be augmented and shared more easily with other managers and the teams.
In order to maintain simple patterns for users, Teams and Projects share similar hierarchy and functionality. Allowing for granular drilldown on the data we have, users can look at developers, commits and code that had the greatest impact on the metrics.
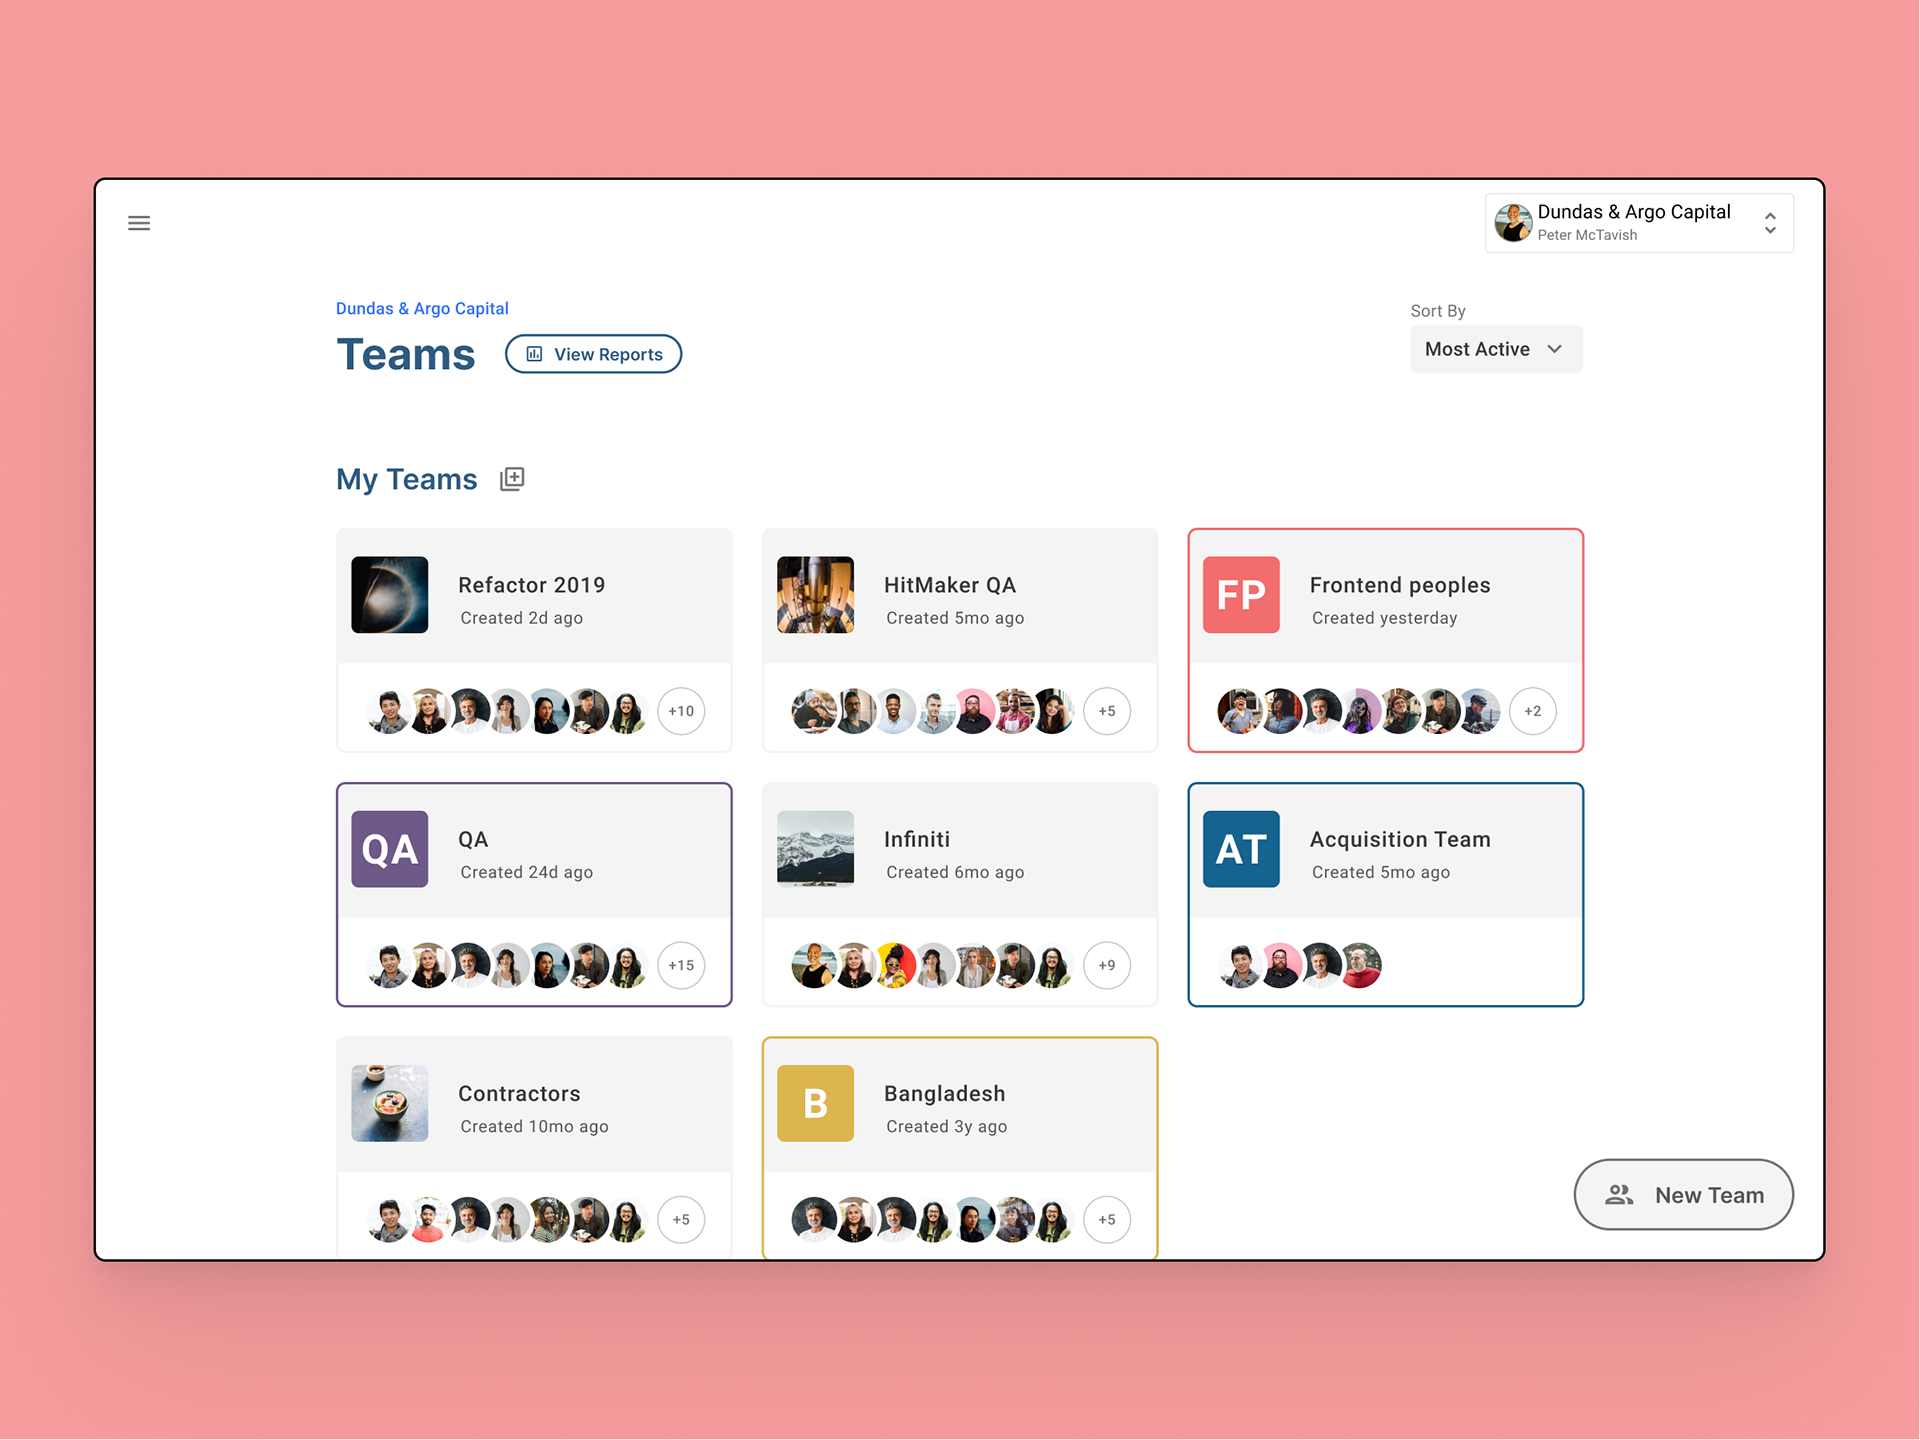
Overview of Teams
Profile of an individual contributor
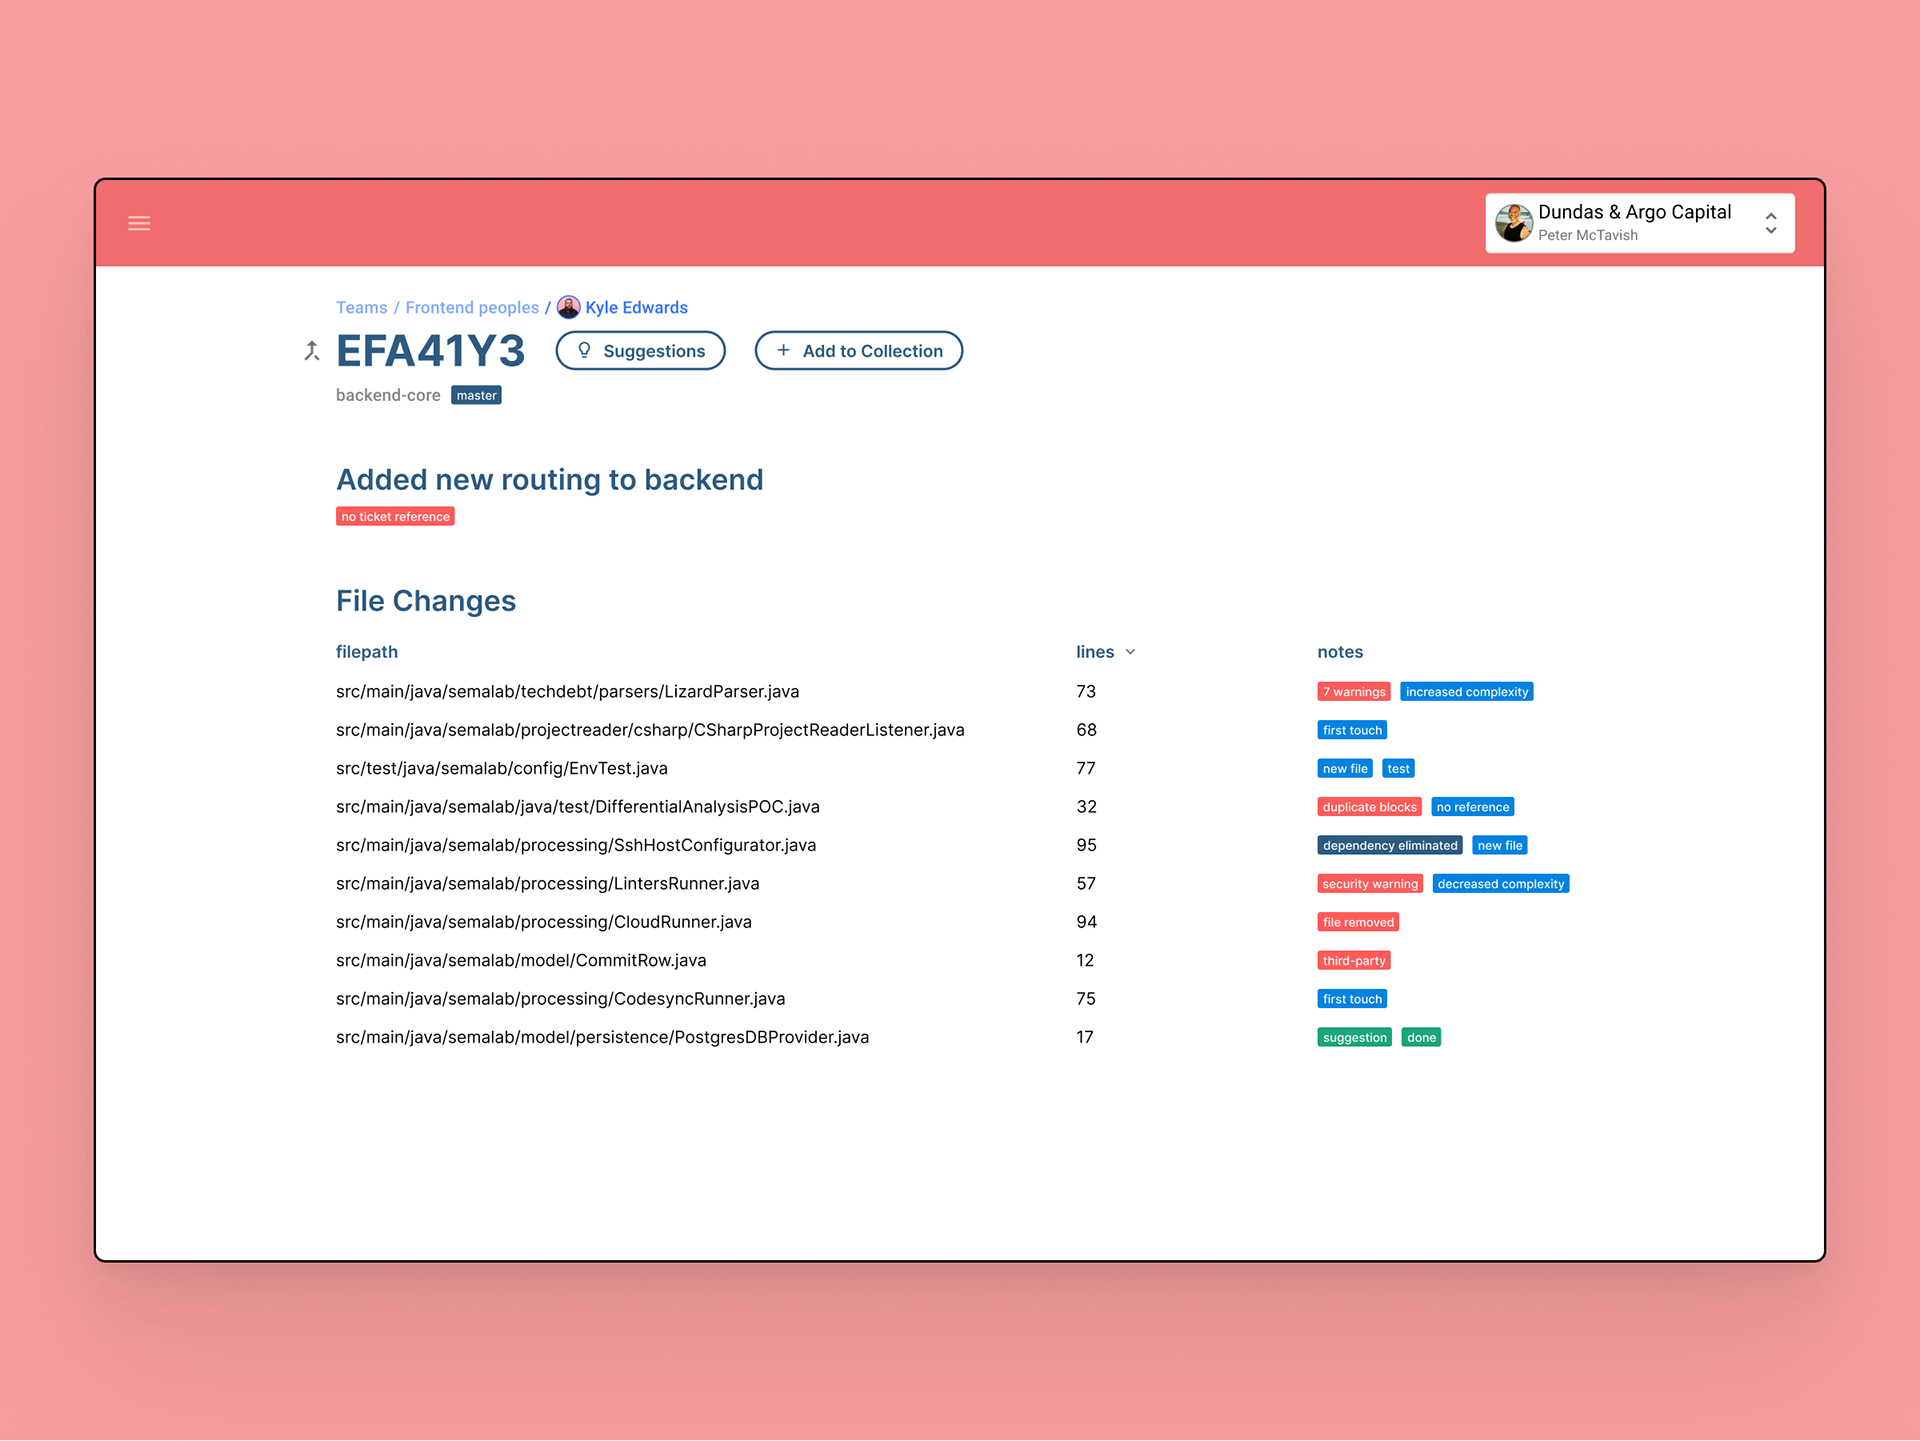
Detail view of a commit automatically tags file changes for any anomolies or significant details
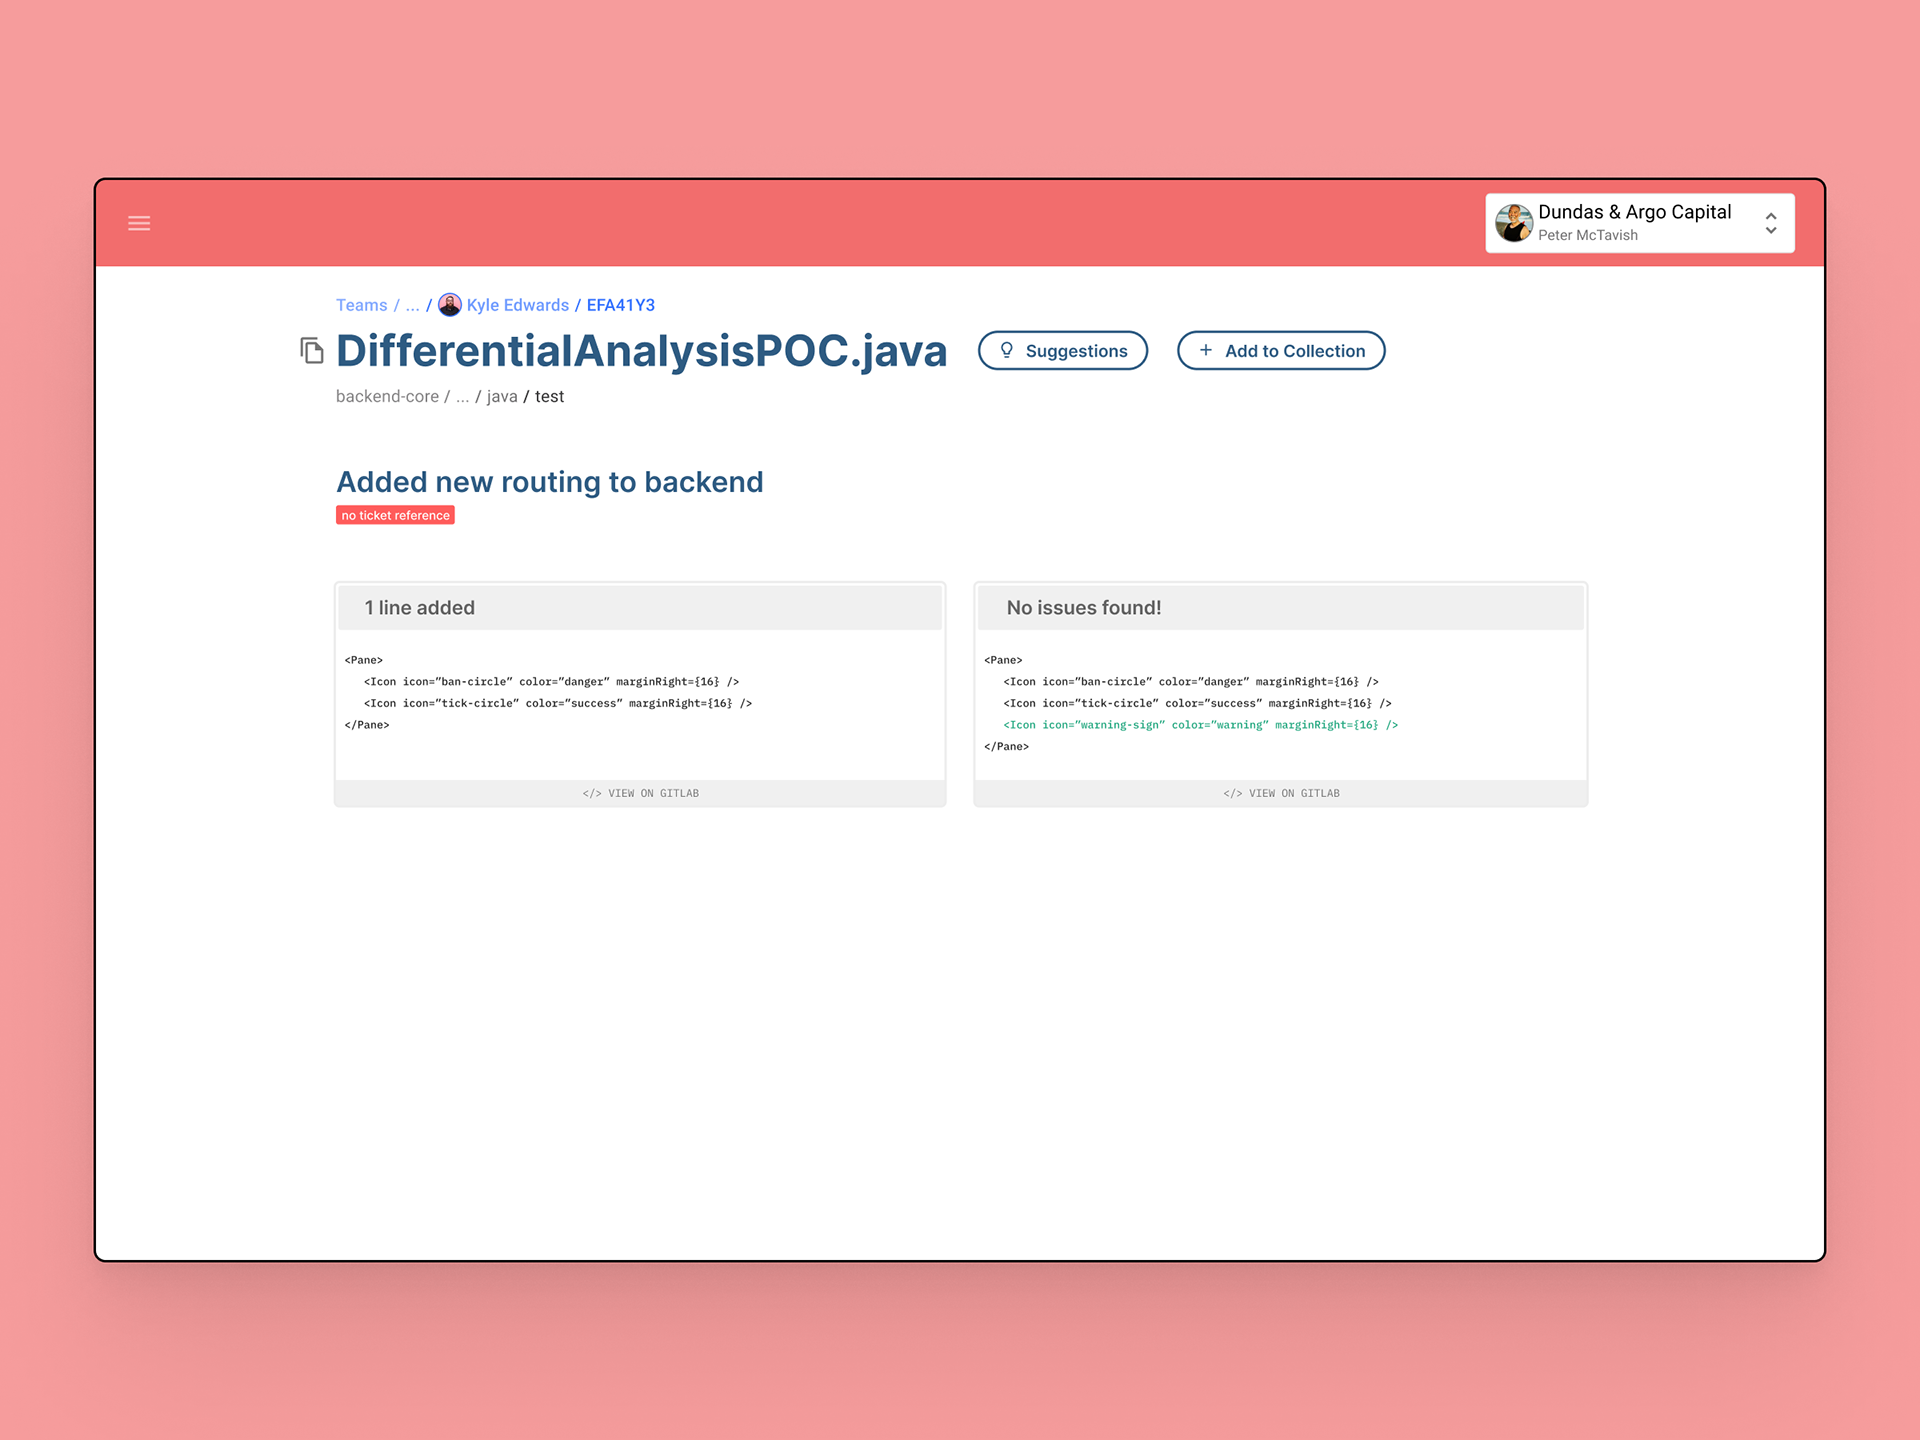
A file change showing the actual line changes made
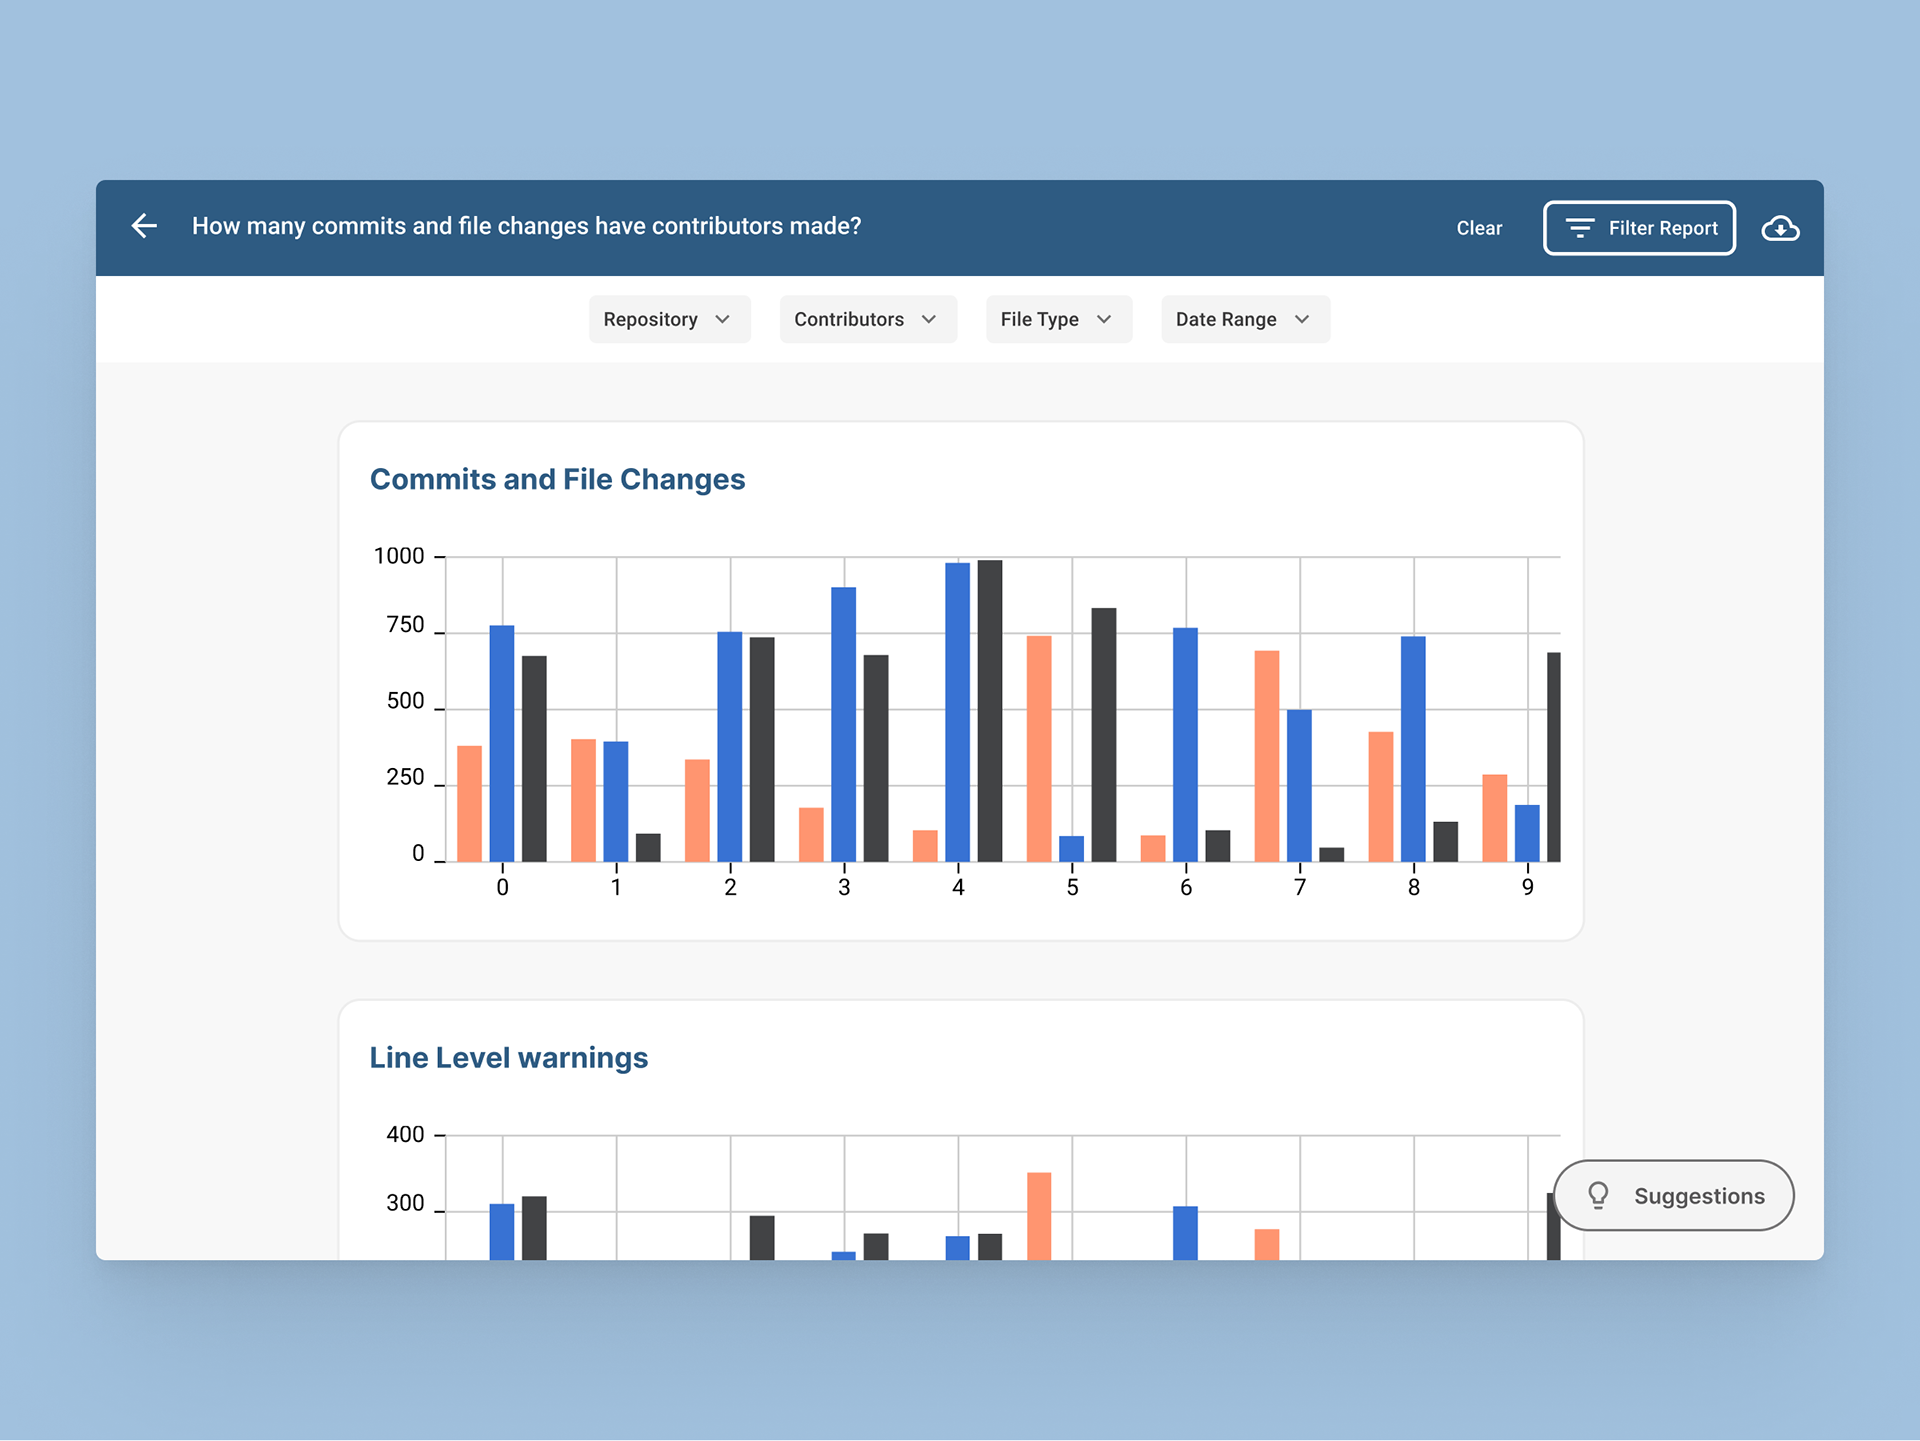
Reports give organizations data to build better software and teams
All of the data and screens of the current web app could be condensed into a Report section powered by a third party BI tool. A list of available reports increases delivery and iteration since it allows product, professional services and research to ship new reports to select users without front-end changes. Take a closer look at reports.
When a user selects 'View Reports' from any other context, they're taken to this space with available related reports and the contextual filters pre-applied. For example;
When I compare duplication in the context of a project, I am able to see the repositories within that project compared to one another. If I accessed that same report from the repository context, the report would compare files or folders within it.
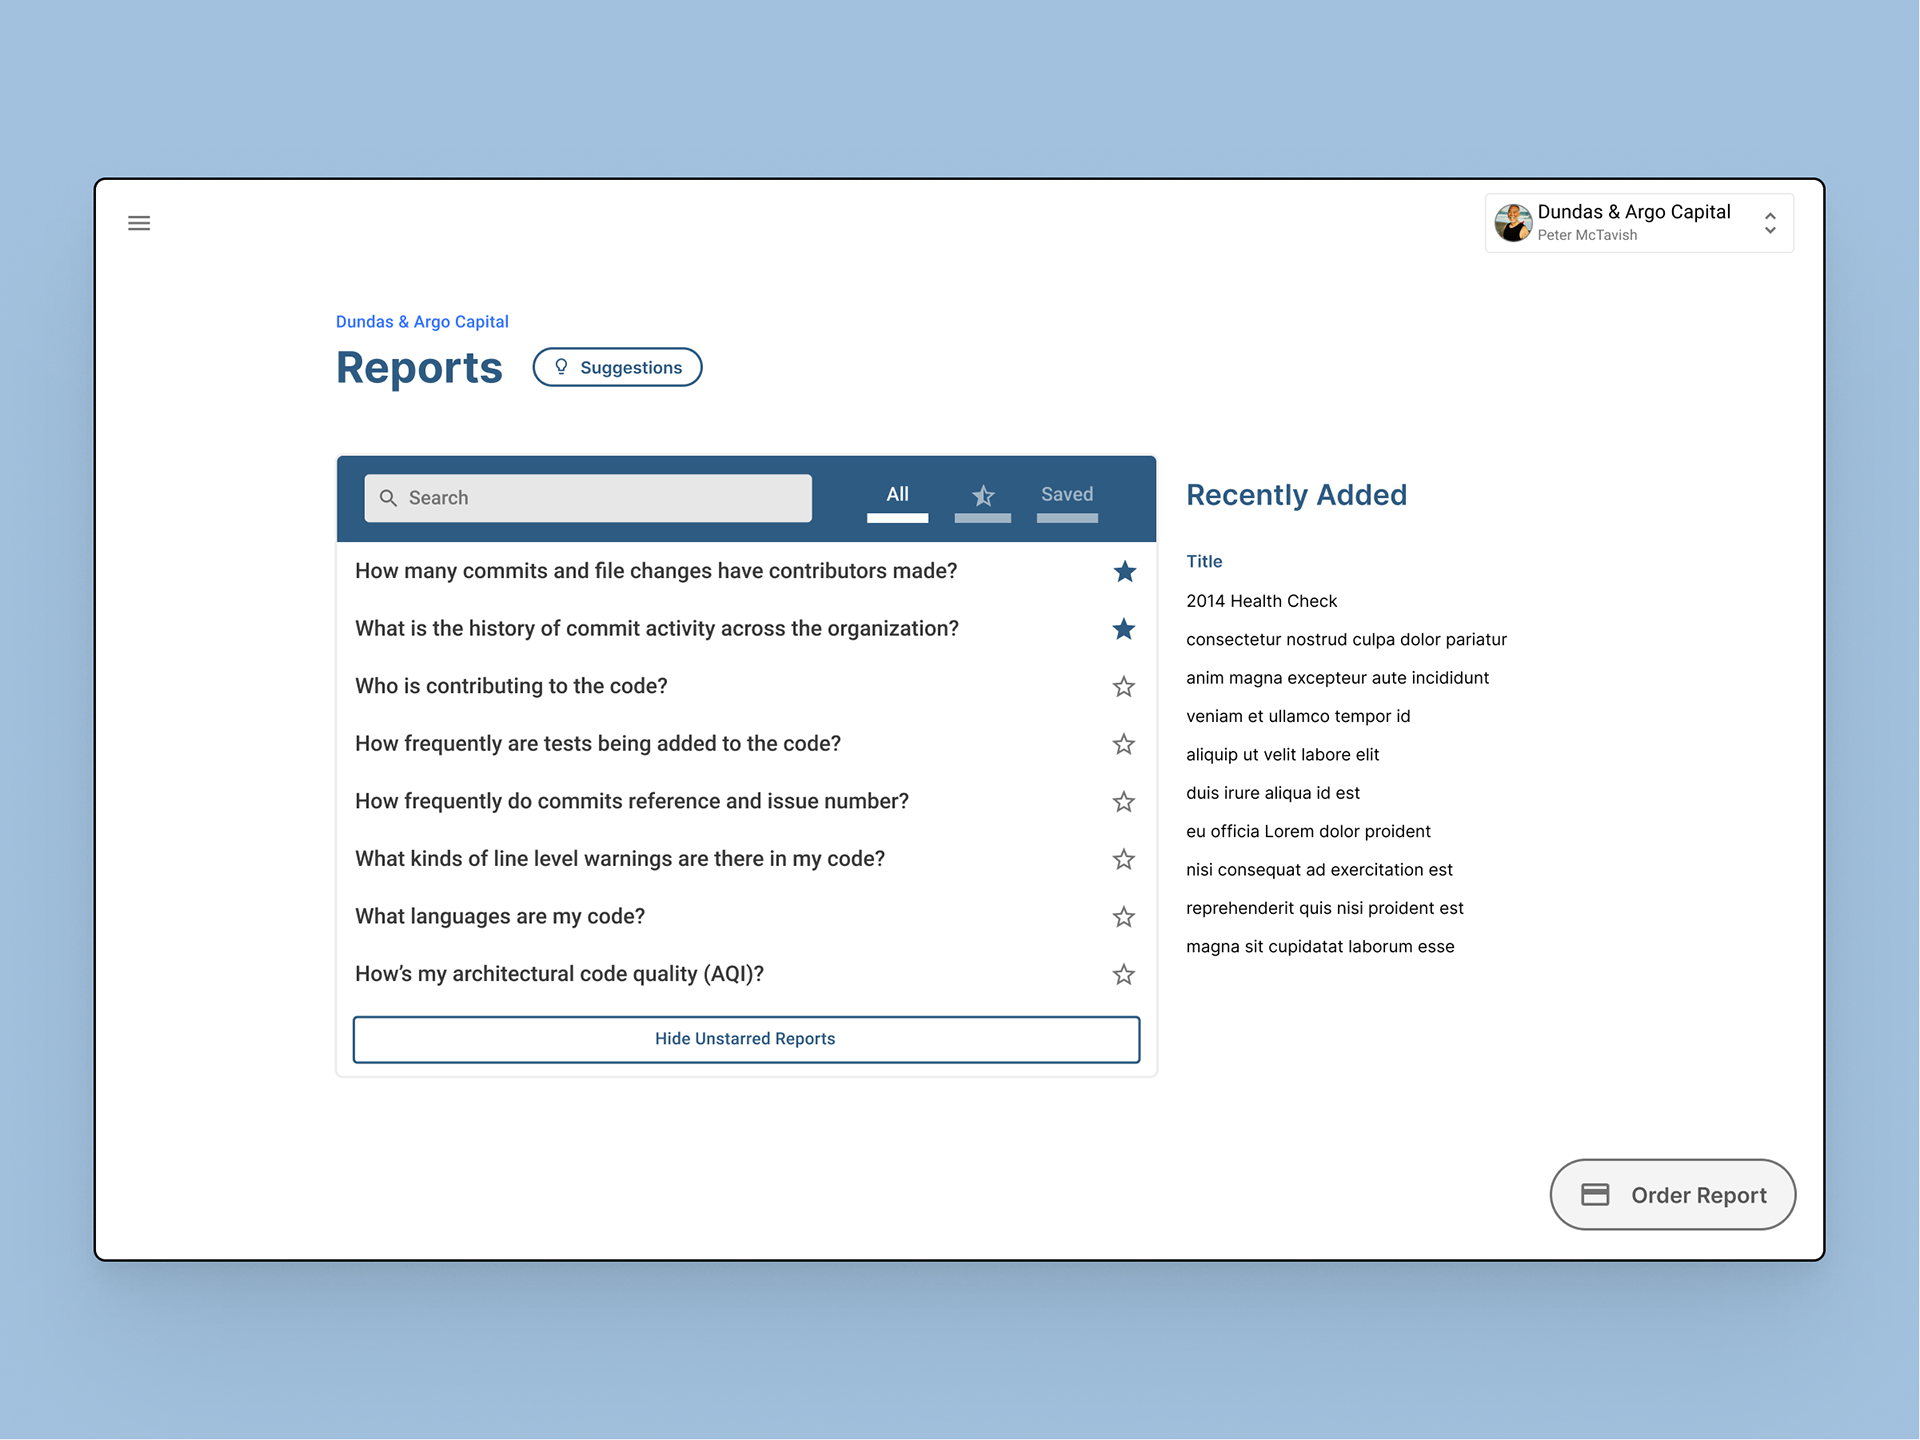
A list of available reports. New custom reporting can be delivered to customers, including one off analyses or regular reporting prepared by professional services. A button to Order Report imagines an additional revenue stream; users connecting with professional services and purchasing one-off reporting outside of what is included in the contract.